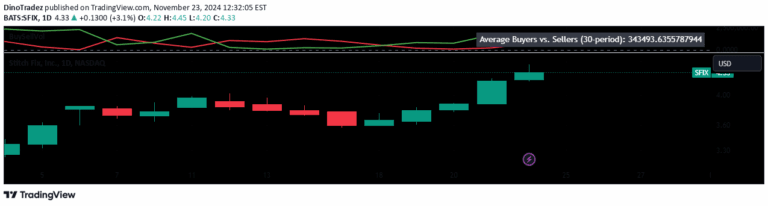
A trading signal panel that detects potential trade entries using volume spikes, EMA crossovers, and session-based timing for precise market entry points across different timeframes.
Explore complementary indicator rolesHow it works
The TR Buy/Sell Signal Panel operates by analyzing multiple market conditions simultaneously. It tracks volume spikes by comparing current volume to a 20-period average using a specific multiplier. The indicator monitors EMA13 and EMA50 crossovers to identify potential trend changes.
Green and red PVSRA candles are used to confirm momentum direction. The system checks active trading sessions in UTC time to validate signals. Arrows are plotted on the chart to indicate potential entry points. A static information panel provides real-time signal condition status
Why it may be useful
This signal panel helps traders make more informed decisions by combining multiple technical analysis methods. It reduces emotional trading by providing rule-based entry criteria. The visual clarity helps traders quickly understand market conditions without complex interpretations.
By integrating volume, moving averages, and session timing, the indicator offers a comprehensive approach to market analysis. Traders can customize settings to match their trading style and risk tolerance. The panel provides a structured method for identifying potential trade opportunities across different markets
When to explore it
The TR Buy/Sell Signal Panel works best during active trading sessions with high liquidity, particularly London and New York hours. It is most effective on timeframes between 5 minutes and 4 hours with sufficient trading volume. Scalpers and intraday traders will find this indicator particularly useful for quick decision-making.
The signal is ideal for markets with consistent volume and clear trending characteristics. Traders following market maker methodologies will appreciate its systematic approach. It performs well in forex, stock, and cryptocurrency markets with predictable trading patterns
Keep exploring
What we’ve verified
Access, alerts and repainting behaviour have not been independently verified for this indicator. Check the creator’s current publication and settings.
General descriptions and classifications are recovered research. Verified details above identify the specific checks we have completed. Check the creator’s current publication for later changes.