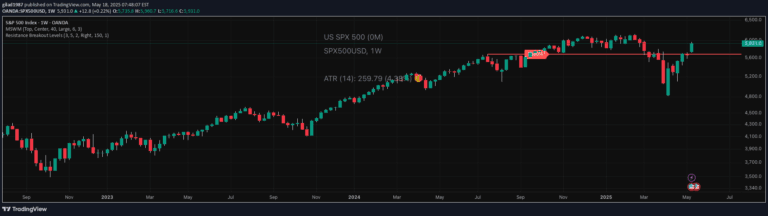
Trend Finder is an indicator that identifies market breakouts by tracking price movements and changing bar colors to signal potential trend shifts and key price level breakthroughs.
Explore complementary indicator rolesHow it works
The Trend Finder indicator monitors the previous high and low price levels of a specified timeframe, tracking price movements and comparing the current close price against these historical reference points. When the current close price surpasses the previous high, the indicator automatically changes the bar color to lime green, signaling a potential bullish breakout.
Conversely, when the current close price drops below the previous low, the bar color shifts to red, indicating a potential bearish breakdown. This visual mechanism allows traders to quickly identify significant price movements and potential trend reversals without complex calculations or additional technical analysis.
Why it may be useful
The Trend Finder provides traders with an immediate visual representation of potential market momentum shifts, helping them quickly recognize when price action might be breaking out of established trading ranges. By simplifying complex price movement analysis into color-coded signals, the indicator reduces cognitive load and enables faster decision-making during volatile market conditions.
Moreover, the indicator's customizable timeframe settings allow traders to adapt the signal to their specific trading style and preferred market analysis approach. This flexibility makes the Trend Finder a versatile tool for identifying potential entry and exit points across different trading strategies and market environments.
When to explore it
The Trend Finder is most effective in markets with clear directional movements and defined price ranges, such as stocks, forex, and liquid futures contracts. Traders can optimize its use during periods of potential trend initiation, where price is likely to break through previous support or resistance levels, indicating a potential sustained price movement.
It works particularly well in combination with other technical indicators that confirm trend strength, such as moving averages or momentum oscillators. Traders should be cautious during choppy or sideways market conditions, where frequent color changes might generate false signals and potentially lead to premature or incorrect trading decisions.
Keep exploring
What we’ve verified
Access, alerts and repainting behaviour have not been independently verified for this indicator. Check the creator’s current publication and settings.
General descriptions and classifications are recovered research. Verified details above identify the specific checks we have completed. Check the creator’s current publication for later changes.