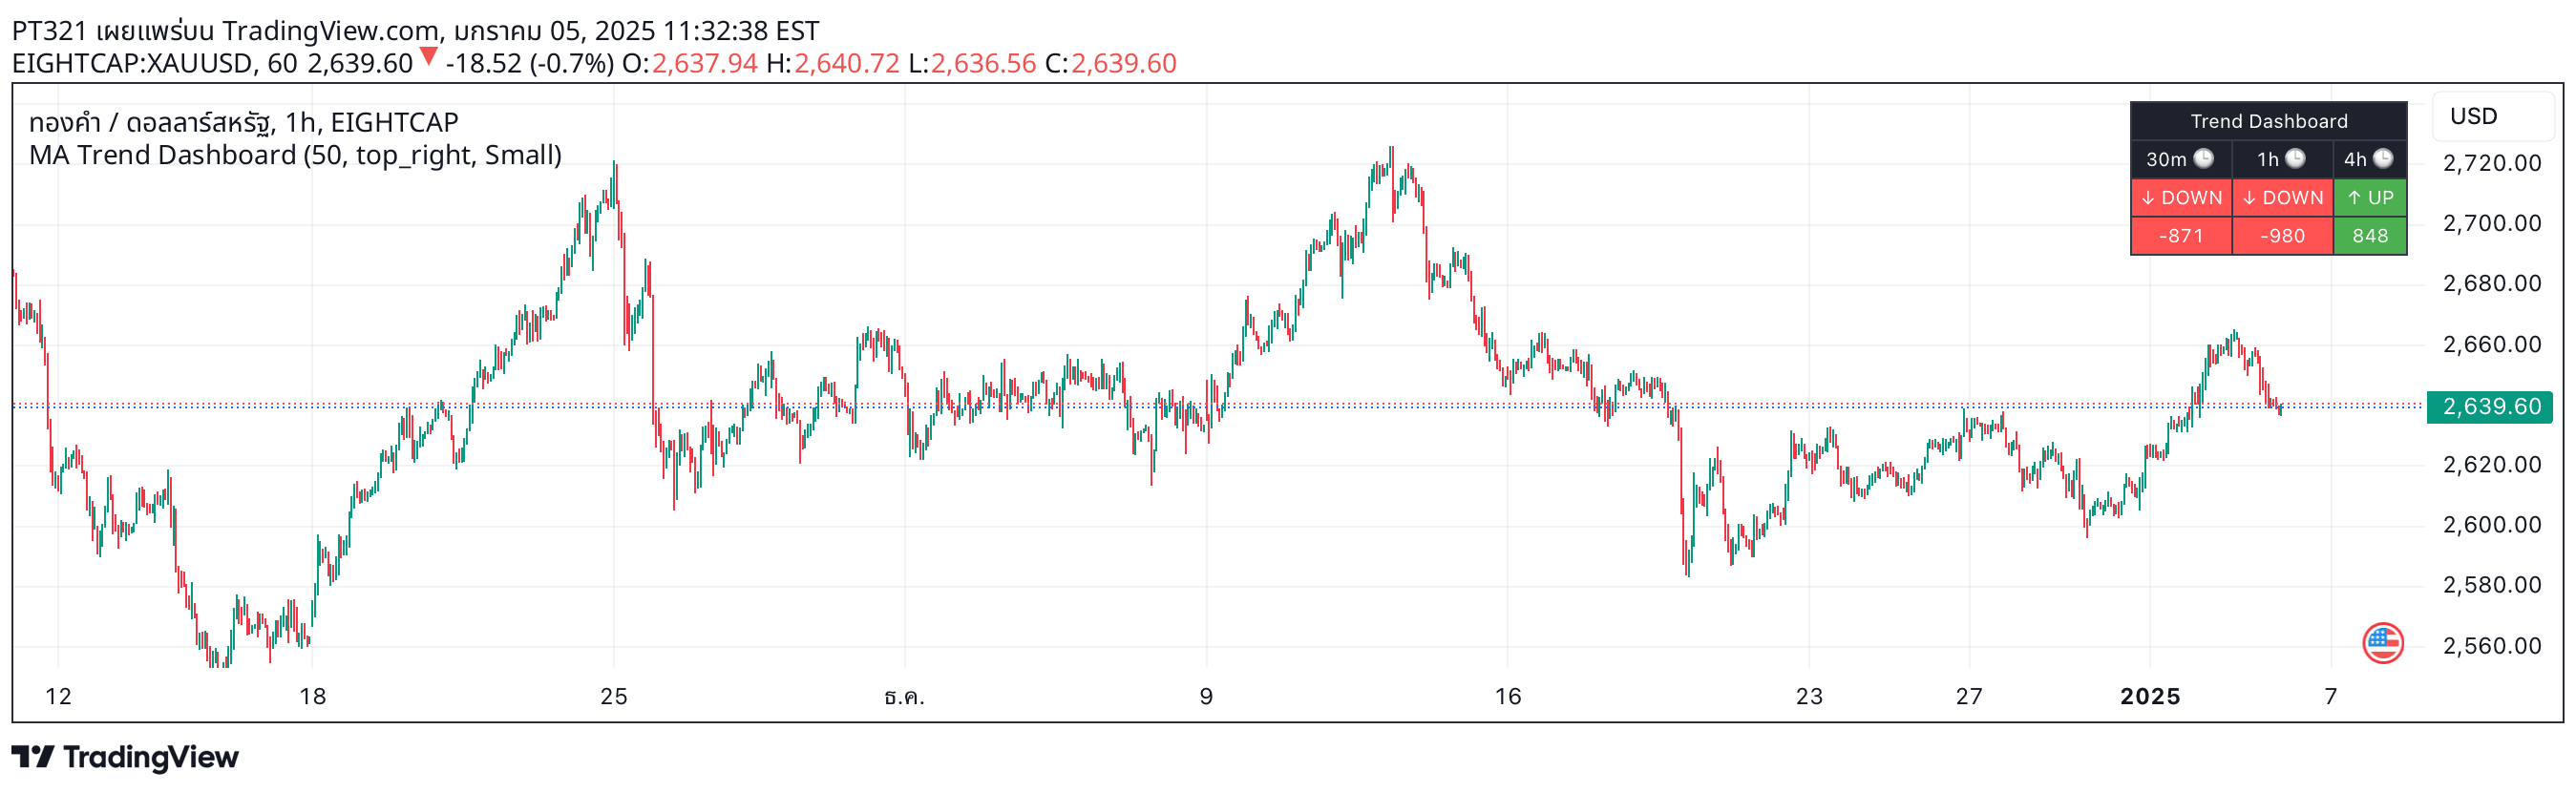
A slope-based indicator that analyzes market trend direction by measuring average inclination and comparing it to a predefined value, revealing market momentum through color-coded visualization.
Explore complementary indicator rolesHow it works
The indicator calculates the average slope of price movement by analyzing the inclination of market trends over a specific period. It uses mathematical algorithms to determine the angle and direction of price progression, translating these calculations into a visual representation with color-coded zones.
By comparing the current slope to a preset comparison value, the indicator dynamically changes colors to signal market conditions. Green indicates an upward trend, red signifies a downward trend, and blue represents a flat or neutral market environment, providing traders with an intuitive visual interpretation of market momentum.
Why it may be useful
This indicator offers traders a quick and intuitive method to understand market trend direction and momentum without complex numerical analysis. By transforming mathematical calculations into color-coded zones, it simplifies trend identification and helps traders make faster, more informed decisions about market movements.
The visual representation allows traders to quickly assess market sentiment and potential trend changes, reducing the cognitive load of interpreting complex technical data. Its straightforward approach makes it accessible to both novice and experienced traders seeking to understand market dynamics at a glance.
When to explore it
The slope-based indicator is most effective during periods of clear market trends, where price movements show consistent directional momentum. It works well in markets with strong directional movements, helping traders identify and confirm trend strength and potential trend reversals.
Traders should utilize this indicator across various timeframes, particularly in day trading and scalping scenarios where quick trend identification is crucial. It is particularly useful in volatile markets where rapid trend changes occur, providing a real-time visual representation of market sentiment and potential trading opportunities.
Keep exploring
What we’ve verified
Access, alerts and repainting behaviour have not been independently verified for this indicator. Check the creator’s current publication and settings.
General descriptions and classifications are recovered research. Verified details above identify the specific checks we have completed. Check the creator’s current publication for later changes.