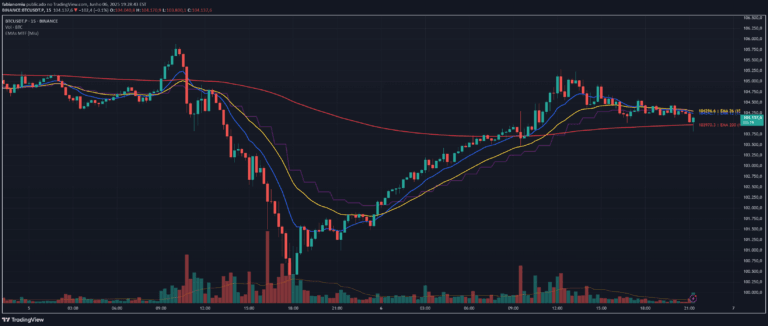
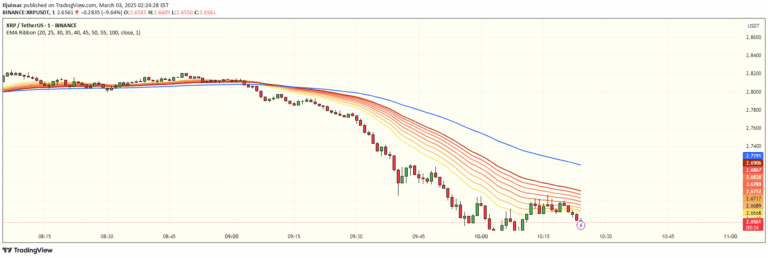
A trend identification tool using two Exponential Moving Averages (EMAs) that visually represents potential market direction through dynamic color changes based on EMA crossovers.
Explore complementary indicator rolesHow it works
The indicator calculates two Exponential Moving Averages (EMAs) with different lengths - typically 9 and 15 periods - using closing prices. These EMAs are plotted directly on the price chart, creating a visual representation of short-term and medium-term price trends.
The core mechanism involves dynamically changing the color of the EMAs based on their relative positions. When the slower EMA crosses above the faster EMA, the color changes to indicate a potential bullish trend, and conversely, when the faster EMA crosses below the slower EMA, the color shifts to signal a potential bearish trend.
Why it may be useful
This EMA-based indicator provides traders with an intuitive and quick method to identify potential trend changes without complex calculations. By using color as a visual cue, traders can rapidly assess market momentum and potential directional shifts, making trend analysis more accessible and immediate.
The simplicity of the color-coded EMA crossover helps traders make faster decisions, reducing the cognitive load of interpreting multiple technical indicators. It offers a straightforward way to understand market dynamics, helping traders quickly distinguish between bullish and bearish market conditions.
When to explore it
The EMA trend indicator is most effective in markets with clear trending characteristics, such as forex, stocks, and cryptocurrencies. It works best in timeframes ranging from short-term (minutes) to medium-term (daily) charts, providing reliable signals during periods of consistent price movement.
Traders should be cautious during highly volatile or choppy market conditions, as rapid price fluctuations can cause frequent and potentially misleading EMA crossovers. It is recommended to combine this indicator with other technical analysis tools to confirm trend signals and reduce the risk of false interpretations.
Keep exploring
What we’ve verified
Access, alerts and repainting behaviour have not been independently verified for this indicator. Check the creator’s current publication and settings.
General descriptions and classifications are recovered research. Verified details above identify the specific checks we have completed. Check the creator’s current publication for later changes.