The Trend Quality Indicator measures trend strength by comparing cumulative price changes against market noise, helping traders identify reliable trend conditions across different timeframes.
Explore complementary indicator rolesHow it works
The Trend Quality Indicator uses a two-step filtering technique to estimate price dynamics by calculating cumulative price change (CPC) over specific semi-cycles. It measures trend performance by dividing the trend by noise, creating a centered oscillator that reveals price movement characteristics.
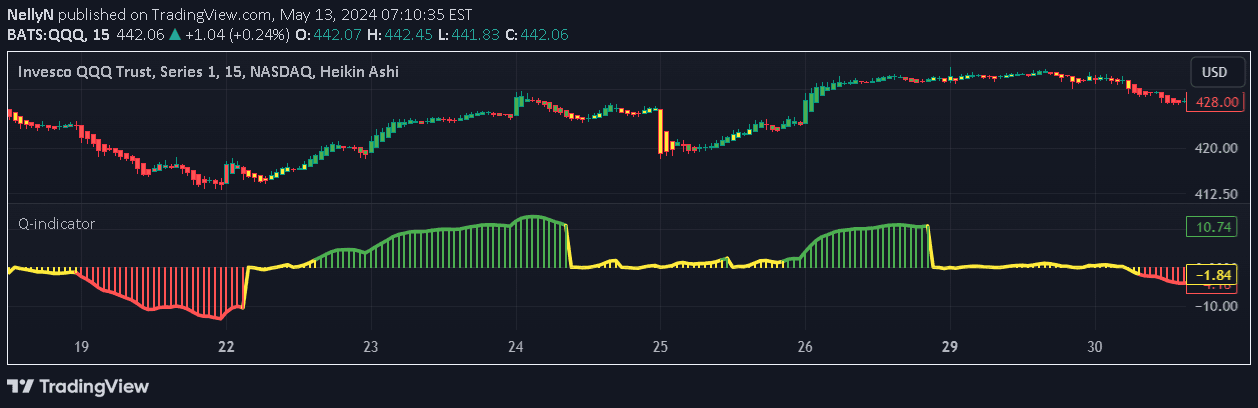
The indicator computes noise through two methods: linear noise (average deviation of cumulative price change from trend) and root mean square noise. By comparing trend against noise, it generates a Q-indicator that ranges from negative to positive values, representing different trend strengths and market conditions.
Why it may be useful
The Trend Quality Indicator provides traders with a sophisticated method to assess trend reliability and strength across various financial instruments. By quantifying the relationship between trend and market noise, it offers insights that go beyond traditional trend identification methods, helping traders make more informed decisions.
Unlike many trend indicators, this tool allows for comparative trend analysis across different securities by normalizing trend measurements. It helps traders distinguish between meaningful trends and random price fluctuations, reducing the likelihood of entering trades during periods of market uncertainty.
When to explore it
The Trend Quality Indicator is most effective in markets with clear directional movements, such as trending stocks, commodities, or forex pairs. It works best when applied across multiple timeframes, allowing traders to confirm trend strength from different perspectives and reduce false signal risks.
Traders should pay special attention when the Q-indicator moves beyond the -1 to +1 range, as this suggests a potentially significant trend. Values between +2 to +5 or -2 to -5 indicate moderate trending, while values exceeding +5 or -5 suggest strong trending conditions that might signal potential overbought or oversold scenarios.
Keep exploring
What we’ve verified
Access, alerts and repainting behaviour have not been independently verified for this indicator. Check the creator’s current publication and settings.
General descriptions and classifications are recovered research. Verified details above identify the specific checks we have completed. Check the creator’s current publication for later changes.