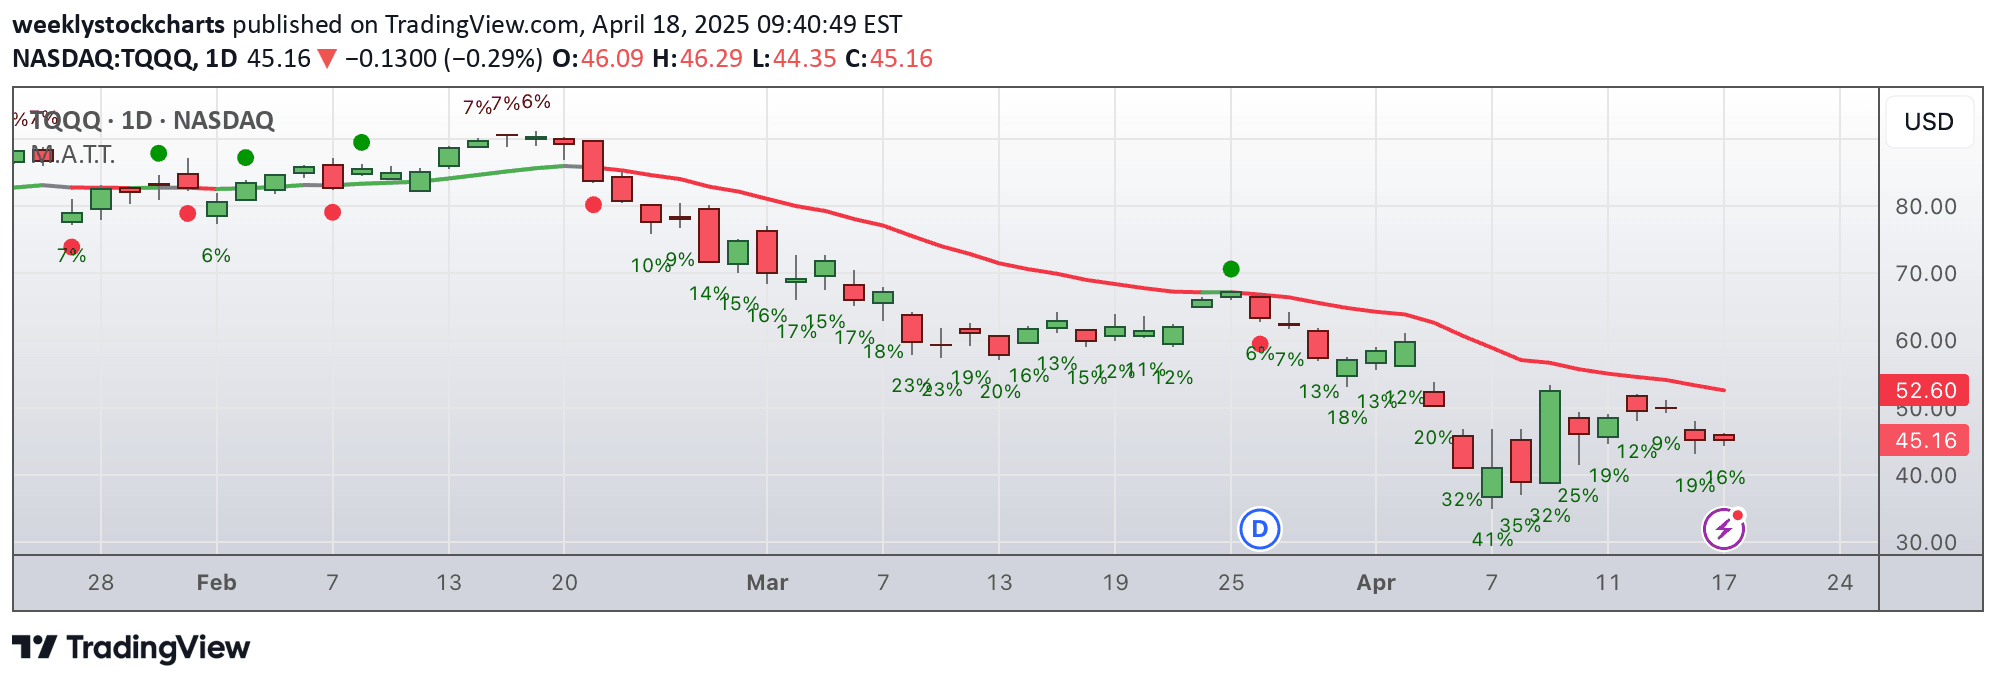
A moving average-based trend indicator that provides dynamic visual signals about market trend direction using 50, 100, and 200 SMAs with color-coded backgrounds.
Explore complementary indicator rolesHow it works
The Trend Zone Moving Averages indicator analyzes the relationships between 50, 100, and 200 simple moving averages to determine market trend conditions. It dynamically changes background colors based on the positioning of price and moving averages, creating visual trend zones that quickly communicate market sentiment.
The indicator generates signals by comparing the order and placement of moving averages and price action. Green backgrounds indicate bullish trends, red backgrounds suggest bearish trends, and yellow backgrounds represent neutral or transitional market conditions.
Why it may be useful
This indicator helps traders quickly interpret market trends by providing an intuitive, color-coded visual representation of trend strength and direction. By simplifying complex moving average relationships, traders can make faster and more informed trading decisions across different financial markets.
The multi-timeframe compatibility and customizable settings make this tool adaptable for various trading styles, from scalping to swing trading. Its real-time alerts and clear trend zone classifications reduce emotional decision-making and help traders maintain disciplined, trend-following strategies.
When to explore it
The Trend Zone Moving Averages indicator works best in markets with clear trending characteristics, such as stocks, forex, cryptocurrencies, and commodities. It is particularly effective during strong bullish or bearish market phases where price consistently respects moving average levels.
Traders should use this indicator in conjunction with other technical analysis tools like support/resistance levels and price action confirmation. It is most valuable when combined with a comprehensive trading strategy that includes proper risk management and entry/exit criteria.
Keep exploring
What we’ve verified
Access, alerts and repainting behaviour have not been independently verified for this indicator. Check the creator’s current publication and settings.
General descriptions and classifications are recovered research. Verified details above identify the specific checks we have completed. Check the creator’s current publication for later changes.