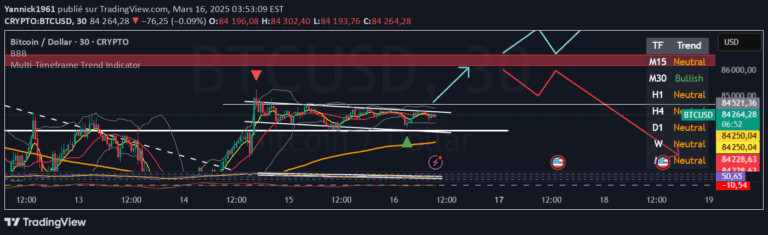
A multi-timeframe trading indicator that uses Average True Range to dynamically calculate stop levels and trend direction, providing precise market entry and exit signals.
Explore complementary indicator rolesHow it works
The Triple Power Stop (CHE) calculates stop levels using Average True Range (ATR) with adjustable multipliers across multiple timeframes. It analyzes market trends by evaluating price movements and volatility, creating dynamic stop levels that adapt to changing market conditions.
The indicator generates color-coded trend lines and entry signals, with green representing uptrends and red signaling downtrends. By incorporating ATR and multi-timeframe analysis, the system provides traders with a comprehensive view of potential market movements and precise entry and exit points.
Why it may be useful
The Triple Power Stop offers traders a sophisticated tool for risk management and trend identification by dynamically adjusting stop levels based on market volatility. Its multi-timeframe approach provides deeper market insights, helping traders make more informed decisions and potentially improving overall trading performance.
By combining volatility analysis, trend detection, and clear visual signals, the indicator reduces emotional trading and provides a systematic approach to market analysis. Traders can customize parameters to match their individual risk tolerance and trading style, making it a versatile tool for different market conditions.
When to explore it
The Triple Power Stop is most effective in markets with clear trending characteristics, where volatility is consistent and price movements are relatively predictable. It performs exceptionally well in forex, cryptocurrency, and stock markets with moderate to high liquidity, where frequent price fluctuations provide multiple signal opportunities.
Traders should utilize this indicator when seeking a comprehensive approach to trend analysis and risk management. It is particularly useful during periods of market transition, helping identify potential trend reversals and providing clear, actionable signals across different timeframes.
Keep exploring
What we’ve verified
Access, alerts and repainting behaviour have not been independently verified for this indicator. Check the creator’s current publication and settings.
General descriptions and classifications are recovered research. Verified details above identify the specific checks we have completed. Check the creator’s current publication for later changes.