
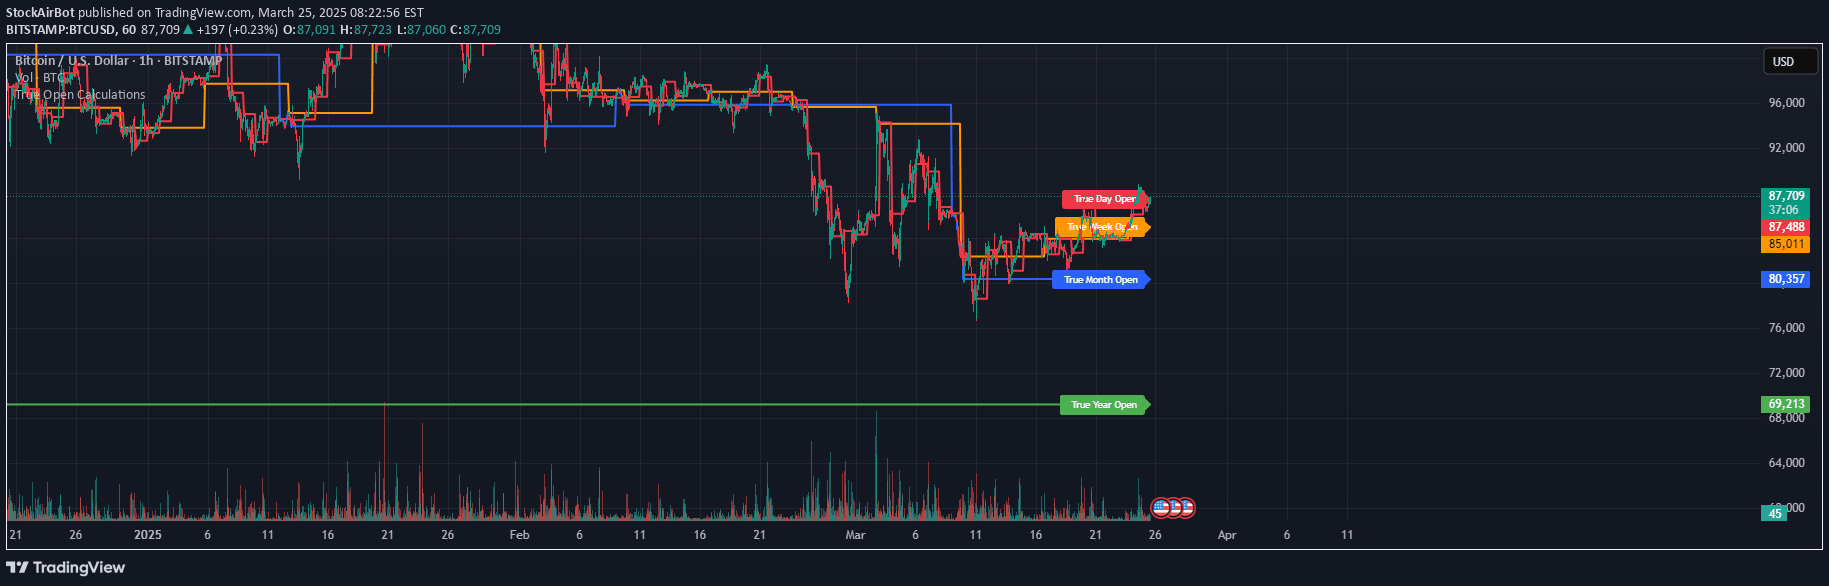
A custom Pine Script indicator that calculates and plots key 'True Open' price levels across different timeframes, providing traders with critical market session reference points.
Explore complementary indicator rolesHow it works
The True Open indicator dynamically calculates opening prices for different time intervals: yearly, monthly, weekly, daily, and New York session. It identifies specific price points based on predetermined rules, such as the first Monday of April for yearly open or 6:00 PM for weekly open.
Each time interval has a unique color-coded line plotted on the chart. The lines are updated in real-time and only displayed on the current candle. Labels are added to help traders quickly understand which 'True Open' level is being represented
Why it may be useful
This indicator provides traders with critical reference points for understanding market trends and price action across multiple timeframes. By visualizing key opening levels, traders can better assess market sentiment, potential support and resistance areas, and trend direction.
The color-coded lines and labels make it easy to quickly interpret different market session opens. Traders can use these levels to make more informed decisions about entry and exit points, and to gain a broader perspective on market movements
When to explore it
The True Open indicator is most effective for traders who want to analyze market movements across different time horizons. It is particularly useful for day traders and swing traders tracking market sessions and trend changes.
Traders can use this indicator during trending markets to identify potential reversal points or confirm existing trends. It works best when combined with other technical analysis tools and when trading liquid markets with clear session structures, such as forex, futures, and major stock indices
Keep exploring
What we’ve verified
Access, alerts and repainting behaviour have not been independently verified for this indicator. Check the creator’s current publication and settings.
General descriptions and classifications are recovered research. Verified details above identify the specific checks we have completed. Check the creator’s current publication for later changes.


