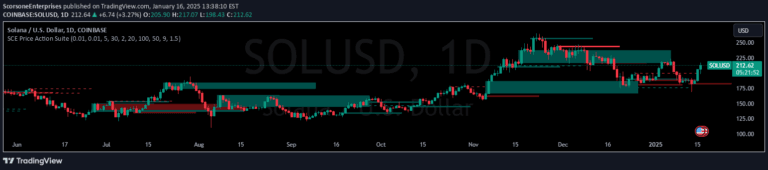
The TEMA Crosses_AIT Indicator uses Triple Exponential Moving Averages to identify trend reversals and momentum shifts by analyzing crossovers between fast and slow TEMA lines.
Explore complementary indicator rolesHow it works
The TEMA Crosses_AIT Indicator calculates two TEMA lines: a fast TEMA (typically 20 periods) and a slow TEMA (typically 200 periods). These lines are computed using a complex formula that involves three exponential moving averages, creating a smoother and more responsive trend line compared to traditional moving averages.
When the fast TEMA crosses above the slow TEMA, it generates a long signal, indicating a potential upward trend. Conversely, when the fast TEMA crosses below the slow TEMA, it produces a short signal, suggesting a potential downward trend. The indicator visually represents these signals with color-coded lines and triangular markers.
Why it may be useful
The TEMA Crosses_AIT Indicator provides traders with a sophisticated method for identifying potential trend reversals and momentum shifts in the market. By combining short-term and long-term trend analysis, it offers a more nuanced view of price movement than traditional moving average systems.
This approach helps traders make more informed decisions by highlighting potential entry and exit points. The color-coded visualization and clear crossover signals make it easier for traders to quickly interpret market dynamics and align their trading strategies with emerging trends.
When to explore it
The TEMA Crosses_AIT Indicator is most effective in markets with clear trending characteristics, such as stocks, cryptocurrencies, forex, and commodities. It performs best in markets that exhibit consistent directional movement, where short-term and long-term trends can be clearly distinguished.
Traders should use this indicator in conjunction with other technical analysis tools like RSI or MACD to confirm signals and reduce false positives. It is particularly useful for traders seeking to capture trend reversals and momentum shifts across different timeframes, from scalping to swing trading.
Keep exploring
What we’ve verified
Access, alerts and repainting behaviour have not been independently verified for this indicator. Check the creator’s current publication and settings.
General descriptions and classifications are recovered research. Verified details above identify the specific checks we have completed. Check the creator’s current publication for later changes.