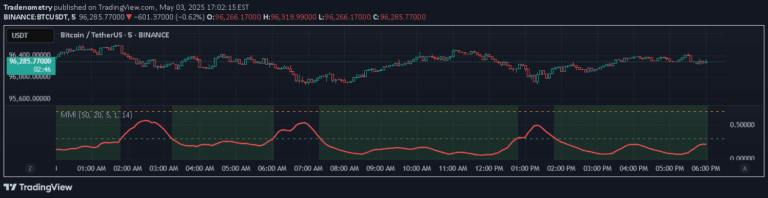
A color-coded candle indicator using dual Bollinger Bands to visually represent market sentiment and volatility without displaying the bands directly.
Explore complementary indicator rolesHow it works
The indicator uses two sets of Bollinger Bands with different standard deviations to analyze price action and market sentiment. By comparing the closing price of each candle to these hidden bands, the script assigns specific colors that represent the strength and direction of market movement.
Green and dark green candles indicate bullish momentum, with dark green representing a stronger upward trend. Red and dark red candles signal bearish sentiment, with dark red showing more intense downward pressure. Grey candles represent neutral or consolidation periods when prices remain within the inner Bollinger Bands.
Why it may be useful
This indicator provides traders with an intuitive visual representation of market dynamics, allowing for quick and easy interpretation of price action and sentiment. By color-coding candles based on their relationship to Bollinger Bands, traders can rapidly assess market conditions without the need for complex analysis.
The dual Bollinger Band approach offers enhanced precision in identifying market trends and potential reversals. This innovative method simplifies trend following by providing immediate insights into market strength, helping traders make more informed decisions and potentially improve their trading strategies.
When to explore it
The indicator is most effective on higher timeframes like daily and weekly charts, where it can help identify and confirm longer-term market trends. It is particularly useful for trend-following strategies that aim to capture significant market movements and avoid short-term noise.
Traders should use this indicator in conjunction with other technical analysis tools to validate signals and make more comprehensive trading decisions. It is especially valuable during periods of clear market trends and can help traders distinguish between minor fluctuations and more significant directional changes.
Keep exploring
What we’ve verified
Access, alerts and repainting behaviour have not been independently verified for this indicator. Check the creator’s current publication and settings.
General descriptions and classifications are recovered research. Verified details above identify the specific checks we have completed. Check the creator’s current publication for later changes.