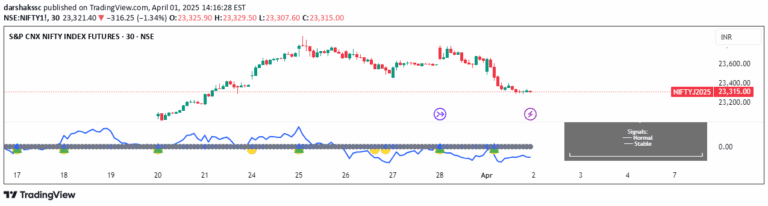
NVT Studio is a Bitcoin price reversal indicator that analyzes Network Value Transaction extremes and offers two visualization modes for identifying potential trend changes.
Explore complementary indicator rolesHow it works
The NVT Studio indicator operates as an oscillator that tracks the Network Value Transaction (NVT) of Bitcoin, revealing potential price reversal areas. It provides two primary visualization modes: one showing short-term NVT oscillations and potential signal areas, and another displaying the actual NVT value with color-coded interpretations.
The indicator uses color-coded signals to represent different levels of confirmation and potential trend reversals. Red and green dots indicate confirmed extremes, while yellow and orange dots represent potential early signals without full confirmation.
Why it may be useful
The NVT Studio provides traders with a unique perspective on Bitcoin's market dynamics by analyzing the network's transactional value relative to its market capitalization. This approach offers insights beyond traditional price analysis, helping traders understand underlying network activity and potential price movements.
By identifying extreme areas in network transaction volume, the indicator can help traders anticipate potential trend reversals and make more informed investment decisions. It bridges the gap between on-chain metrics and price action, offering a sophisticated tool for understanding Bitcoin's market behavior.
When to explore it
The NVT Studio is most effective when used on Bitcoin (INDEX:BTCUSD) with daily or weekly timeframes, making it particularly suitable for swing trading and longer-term investment strategies. Traders should focus on the indicator's signals during periods of significant market uncertainty or potential trend transitions.
The indicator works best when combined with other technical and fundamental analysis tools, providing an additional layer of insight into Bitcoin's market dynamics. Traders should pay special attention to confirmed signals (red/green dots) and use the indicator as part of a comprehensive trading strategy.
Keep exploring
What we’ve verified
Access, alerts and repainting behaviour have not been independently verified for this indicator. Check the creator’s current publication and settings.
General descriptions and classifications are recovered research. Verified details above identify the specific checks we have completed. Check the creator’s current publication for later changes.