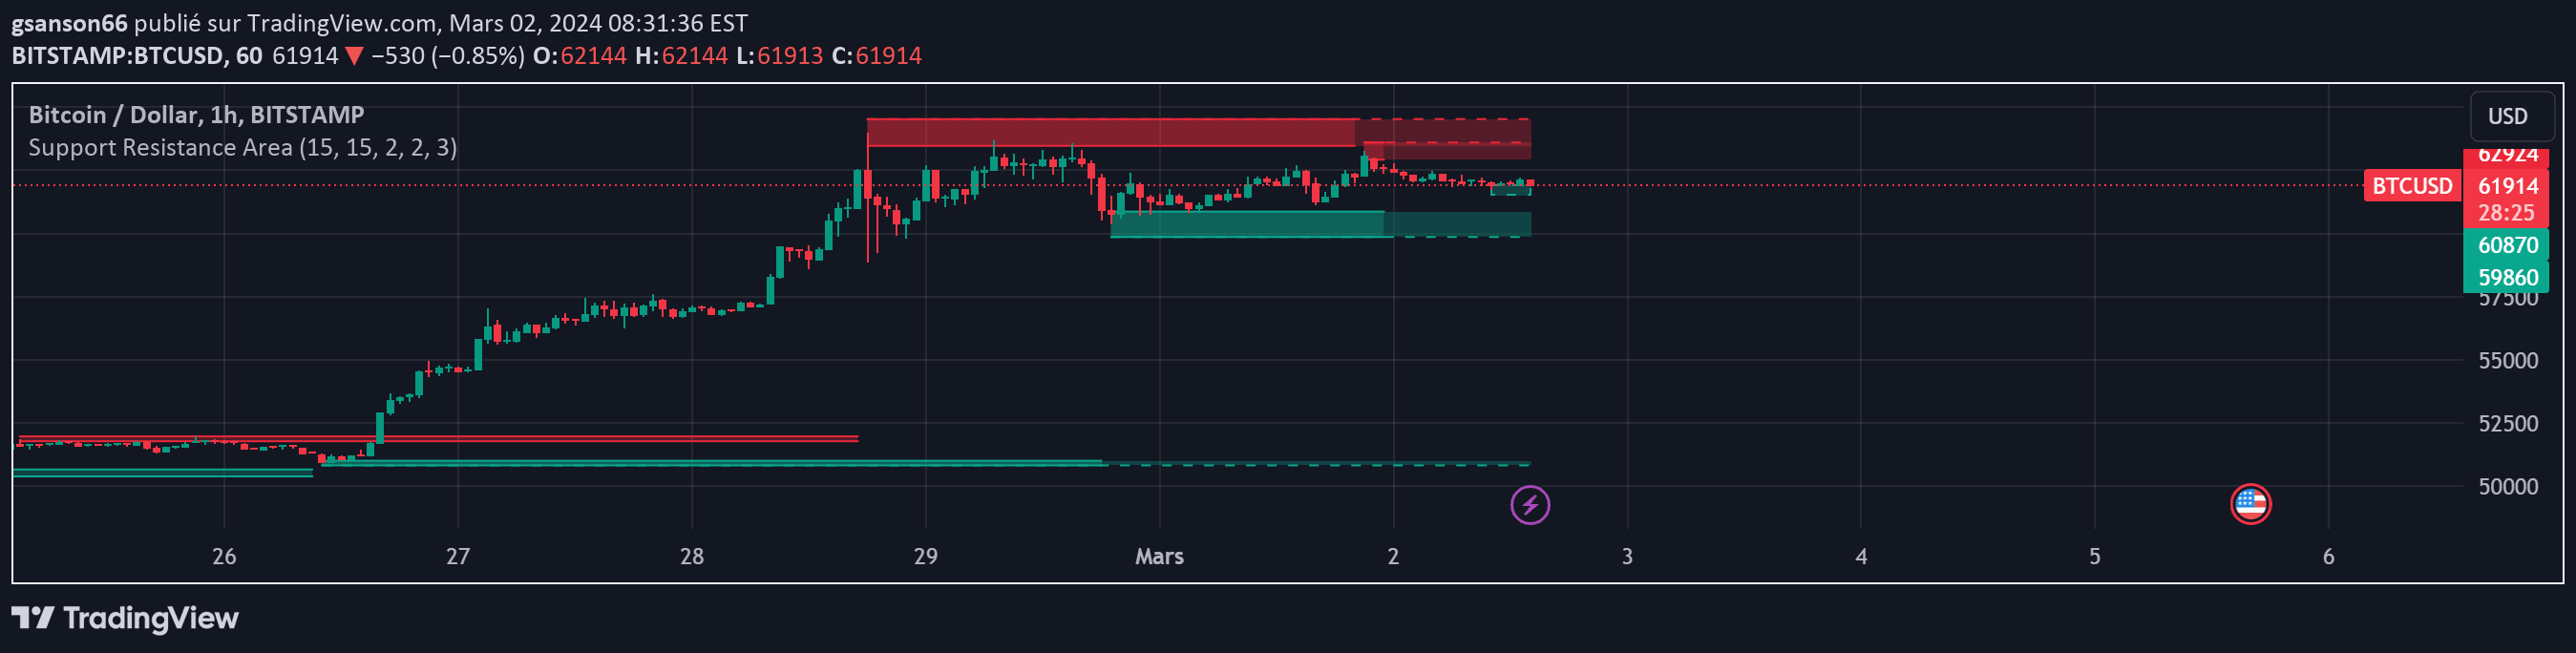
A custom support/resistance zone indicator that automatically identifies key price levels across different timeframes, adapting to asset volatility and providing flexible zone detection.
Explore complementary indicator rolesHow it works
The indicator first detects pivot points on a selected timeframe by examining price data within a specified lookback period. It uses a configurable pivot period to identify potential support and resistance zones, considering the asset's long-term Average True Range (ATR) to automatically adjust zone sensitivity.
After identifying pivot points, the system combines nearby points into zones based on price tolerance and volatility. If enabled, the 'fat zones' feature merges zones that are close together, creating broader support and resistance areas. The indicator ensures that only zones touched by at least two separate pivot points are displayed, providing a robust method of identifying significant price levels.
Why it may be useful
Support and resistance zones are critical for understanding potential price reversal or continuation points in trading. By automatically generating these zones, traders can quickly identify key levels without manually drawing them, saving time and reducing subjective interpretation.
The indicator's adaptive approach, which considers asset-specific volatility and allows flexible configuration, makes it a powerful tool for traders across different markets and trading styles. Its ability to work consistently across timeframes and provide both live and historical zone perspectives enhances traders' strategic decision-making capabilities.
When to explore it
This indicator works best in markets with clear trending or range-bound behavior, where support and resistance levels play a significant role in price movement. It is particularly useful for traders who want an objective, data-driven approach to identifying key price levels without relying solely on manual analysis.
The indicator is most effective when combined with other technical analysis tools and when traders adjust its parameters to match the specific characteristics of the asset they are trading. Its versatility makes it suitable for various financial instruments, including stocks, forex, cryptocurrencies, and futures markets.
Keep exploring
What we’ve verified
Access, alerts and repainting behaviour have not been independently verified for this indicator. Check the creator’s current publication and settings.
General descriptions and classifications are recovered research. Verified details above identify the specific checks we have completed. Check the creator’s current publication for later changes.