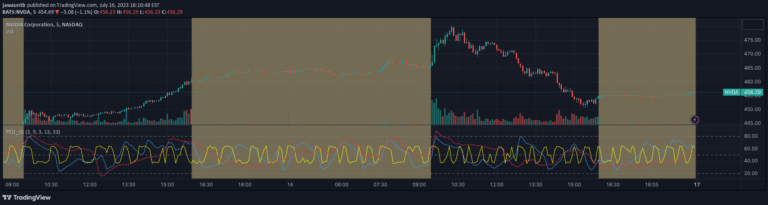
A VIX-based oscillator that tracks roll yield and volatility trends, providing insights into market sentiment and potential volatility changes across different contract months.
Explore complementary indicator rolesHow it works
The indicator measures the roll yield between VIX front-month and next-month futures contracts, creating an oscillating line that represents the relationship between these contracts. When the line is above zero, the market is in contango, with front-month contracts priced lower than next-month contracts, which is the typical market condition.
An exponential moving average (EMA) is overlaid on the roll yield line, changing colors to indicate trend direction. The EMA turns green when trending up and red when trending down, offering visual confirmation of volatility and roll yield changes across different market conditions.
Why it may be useful
This indicator provides traders with a sophisticated tool for understanding volatility dynamics and potential market turning points. By tracking the roll yield and its associated EMA, traders can gain insights into whether market volatility is expanding or contracting, which can be critical for making informed trading decisions.
The signal helps traders anticipate potential shifts in market sentiment by highlighting changes in volatility trends. It can be particularly useful for traders dealing with volatility-based ETFs and index trading, offering a nuanced view of market conditions beyond traditional price-based indicators.
When to explore it
The indicator is most effective when used on one-hour charts, particularly for tracking VIX futures, SPY, or major stock indices. Traders should pay close attention to color changes in the EMA, as transitions from red to green or green to red can signal potential volatility shifts and market turning points.
It is particularly valuable during periods of market uncertainty or when looking to enter or exit volatility-related positions. Traders can use this tool to confirm trading signals, manage risk, and identify potential entry and exit points for short or long volatility strategies.
Keep exploring
What we’ve verified
Access, alerts and repainting behaviour have not been independently verified for this indicator. Check the creator’s current publication and settings.
General descriptions and classifications are recovered research. Verified details above identify the specific checks we have completed. Check the creator’s current publication for later changes.