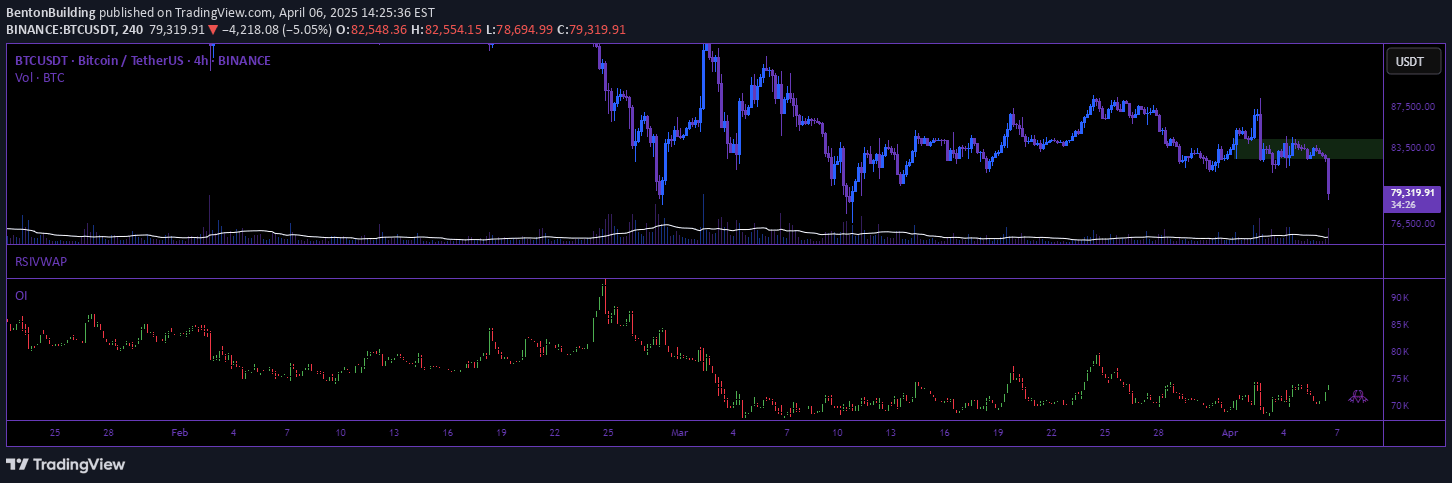
A specialized technical indicator measuring cryptocurrency price volatility using logarithmic returns and statistical methods to provide insights into market fluctuations and risk.
Explore complementary indicator rolesHow it works
The Crypto Volatility Index calculates price volatility by first computing logarithmic returns, which represent normalized price changes between consecutive periods. It then determines the average return using a Simple Moving Average and calculates variance by measuring the dispersion of returns from this average.
Standard deviation is then derived by taking the square root of the variance, which provides a direct measure of market volatility. The indicator plots these values in a separate panel, allowing traders to visually assess the current market's price fluctuation intensity and potential risk levels.
Why it may be useful
The Crypto Volatility Index offers traders a sophisticated method for understanding market risk and potential price movements in cryptocurrency markets. By providing a nuanced view of price fluctuations, it helps traders make more informed decisions about potential entry and exit points.
This indicator is particularly valuable in the highly volatile cryptocurrency space, where traditional volatility measures might not capture the unique characteristics of digital asset price movements. It enables traders to adjust their strategies dynamically based on real-time volatility insights.
When to explore it
The Crypto Volatility Index is most effective during periods of significant market uncertainty or potential trend changes in cryptocurrency markets. Traders can use it to identify potential high-risk trading environments and adjust their risk management strategies accordingly.
It works particularly well when combined with other technical indicators like moving averages, RSI, or Bollinger Bands, providing a comprehensive view of market conditions. Short-term traders can benefit from its rapid volatility detection, while long-term investors can use it to understand broader market trends and potential systemic risks.
Keep exploring
What we’ve verified
Access, alerts and repainting behaviour have not been independently verified for this indicator. Check the creator’s current publication and settings.
General descriptions and classifications are recovered research. Verified details above identify the specific checks we have completed. Check the creator’s current publication for later changes.