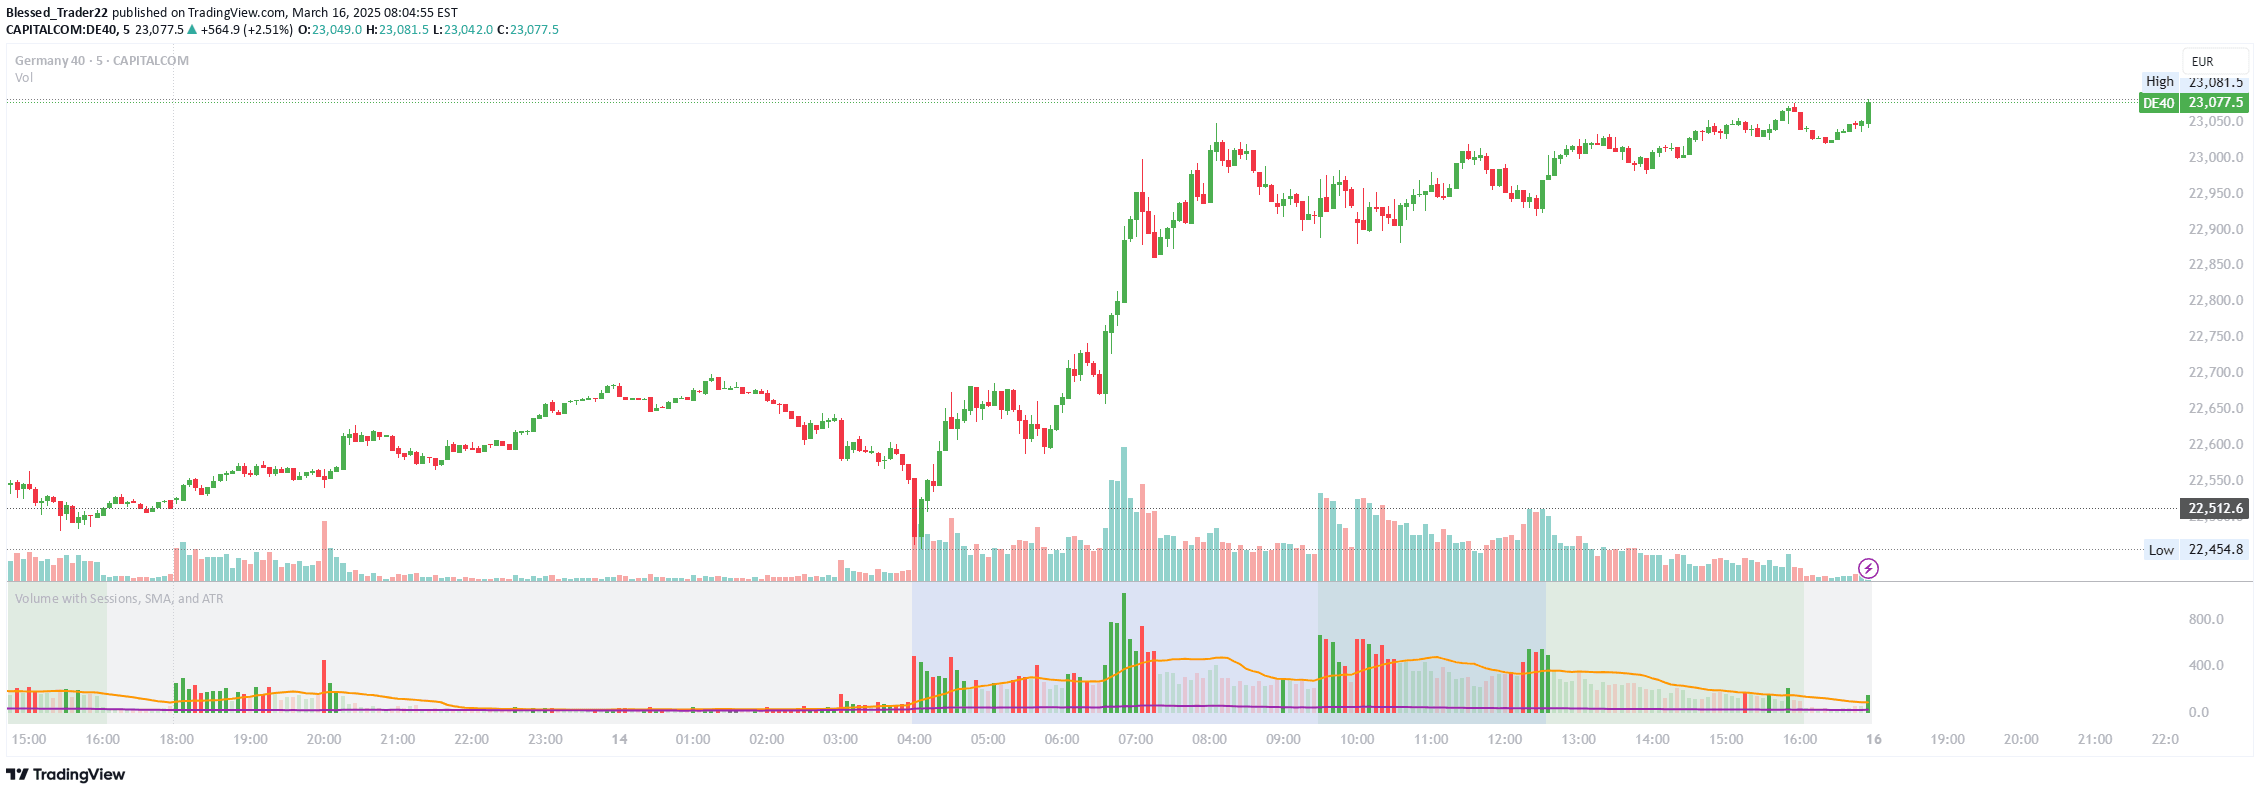
A volume-based indicator that identifies and highlights periods of low trading volume by comparing current volume against the highest volume in a defined historical period.
Explore complementary indicator rolesHow it works
The indicator analyzes volume data across a customizable lookback period, typically 20 to 50 candles, to determine the highest volume traded during that timeframe. It then establishes a percentage threshold, default set at 16%, which serves as a benchmark for volume comparison.
Once the threshold is set, the indicator automatically identifies and marks candles with trading volume below this percentage level. These low-volume candles are visually highlighted on the volume chart, allowing traders to quickly recognize periods of reduced market activity and potential consolidation zones.
Why it may be useful
Volume analysis is crucial for understanding market dynamics and potential price movements. By highlighting low-volume periods, traders can gain insights into market sentiment, potential trend weakness, or consolidation phases that might precede significant price changes.
This indicator provides a visual tool to quickly assess volume trends, helping traders make more informed decisions about market participation, trend strength, and potential entry or exit points based on trading volume characteristics.
When to explore it
This volume indicator is most effective in highly liquid markets with consistent trading activity, such as major forex pairs, stock indices, and popular cryptocurrencies. It works best during active trading sessions when volume data provides meaningful market insights.
Traders should use this tool in conjunction with price action analysis and other technical indicators to confirm signals and validate potential trading opportunities. It is particularly useful for identifying periods of low market engagement and potential trend transitions.
Keep exploring
What we’ve verified
Access, alerts and repainting behaviour have not been independently verified for this indicator. Check the creator’s current publication and settings.
General descriptions and classifications are recovered research. Verified details above identify the specific checks we have completed. Check the creator’s current publication for later changes.