
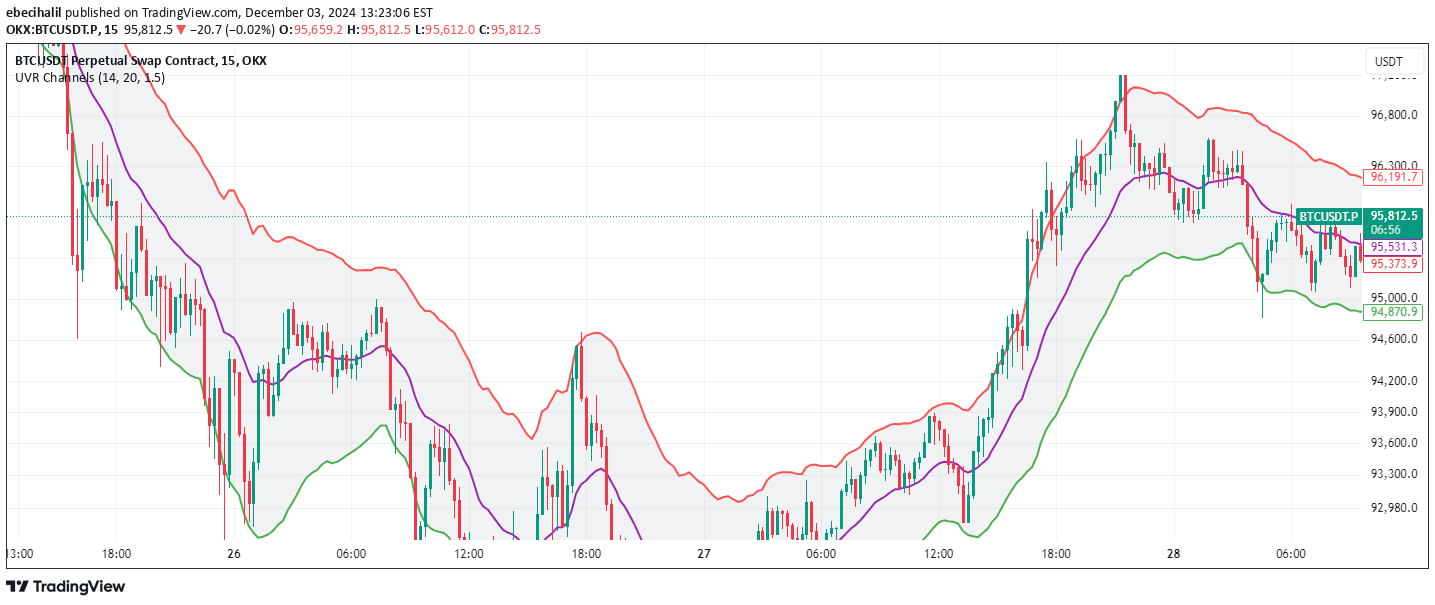
UVR Channels dynamically measure market volatility using a custom formula, creating adaptive bands that help traders identify trend strength, potential reversals, and market conditions.
Explore complementary indicator rolesHow it works
The UVR Channels are constructed using a unique volatility calculation method that compares price extremes between current and previous candles. It first calculates two volatility components by measuring the absolute differences between high and low prices, then selects the larger component as the Volatility Ratio.
This Volatility Ratio is then smoothed using a Smoothed Moving Average (SMMA) over a specified period. An Exponential Moving Average (EMA) serves as the central reference line, with upper and lower bands created by adding and subtracting the smoothed volatility multiplied by a user-defined multiplier.
Why it may be useful
UVR Channels provide traders with a dynamic and adaptive tool for understanding market conditions beyond traditional volatility indicators. By capturing price movement extremes, these channels offer insights into potential trend strength, reversals, and market volatility that standard indicators might miss.
The unique approach allows traders to quickly visualize market dynamics, with expanding bands signaling increased volatility and contracting bands indicating potential consolidation or upcoming significant price movements. This makes UVR Channels a versatile and informative analysis tool for traders across different timeframes and market conditions.
When to explore it
UVR Channels are most effective in markets with clear trending or transitional characteristics, where volatility plays a significant role in price movement. They work exceptionally well in identifying potential trend reversals, breakout conditions, and shifts in market momentum across various financial instruments and timeframes.
Traders should pay special attention when price consistently approaches the upper or lower bands, as these can signal overbought or oversold conditions. The indicator is particularly useful during periods of market uncertainty, helping traders gauge potential price direction and volatility changes more accurately.
Keep exploring
What we’ve verified
Access, alerts and repainting behaviour have not been independently verified for this indicator. Check the creator’s current publication and settings.
General descriptions and classifications are recovered research. Verified details above identify the specific checks we have completed. Check the creator’s current publication for later changes.


