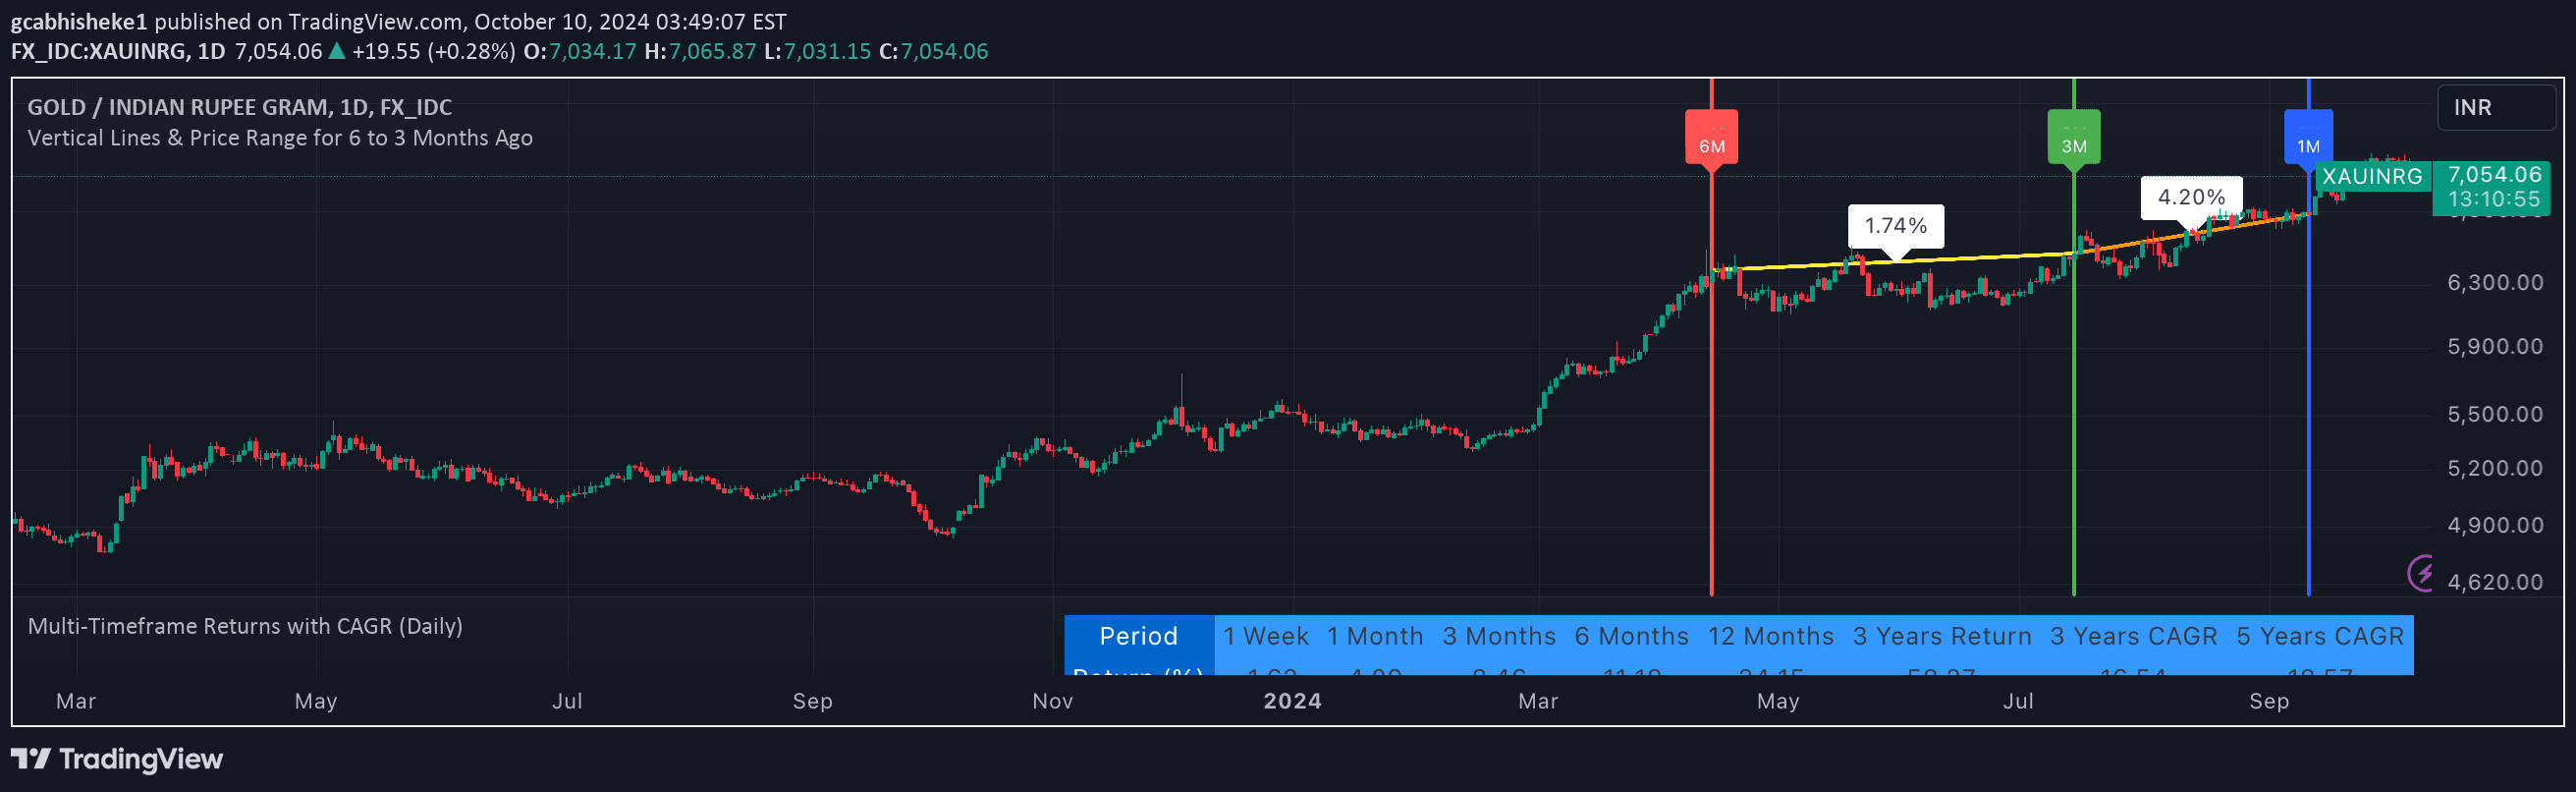
A specialized indicator that helps traders visualize yearly price boundaries by drawing vertical and horizontal lines marking previous year's price levels and important market transitions.
Explore complementary indicator rolesHow it works
The Yearly Vertical & Open Lines Indicator analyzes annual price data and automatically generates visual markers on the trading chart. It creates vertical lines precisely at the start of each calendar year, which helps traders immediately recognize key temporal boundaries and transition points in market structure.
Additionally, the indicator draws horizontal lines representing the previous year's opening and closing prices, providing instant reference points for historical price levels. Traders can customize the indicator's appearance by adjusting line colors, styles, and enabling optional price labels to enhance visual clarity and information density.
Why it may be useful
By providing a structured visual representation of yearly price boundaries, this indicator helps traders understand long-term market context and historical price levels. It transforms complex annual price data into immediately comprehensible visual markers that can inform strategic decision-making and highlight potential support/resistance zones.
The ability to see previous year's price levels allows traders to quickly assess market trends, identify potential turning points, and develop more informed trading strategies. These annual reference lines can serve as critical psychological price levels that often influence market participant behavior.
When to explore it
The Yearly Vertical & Open Lines Indicator is most effective for traders analyzing markets with clear annual cycles or those seeking to understand broader market structural dynamics. It works particularly well for traders who want to maintain a macro perspective while making short to medium-term trading decisions.
Traders can benefit most from this indicator when analyzing markets like stocks, futures, or forex, where annual price cycles and year-end/year-beginning market behaviors are significant. It is especially useful at the beginning of a new trading year or when evaluating long-term market trends and potential seasonal patterns.
Keep exploring
What we’ve verified
Access, alerts and repainting behaviour have not been independently verified for this indicator. Check the creator’s current publication and settings.
General descriptions and classifications are recovered research. Verified details above identify the specific checks we have completed. Check the creator’s current publication for later changes.