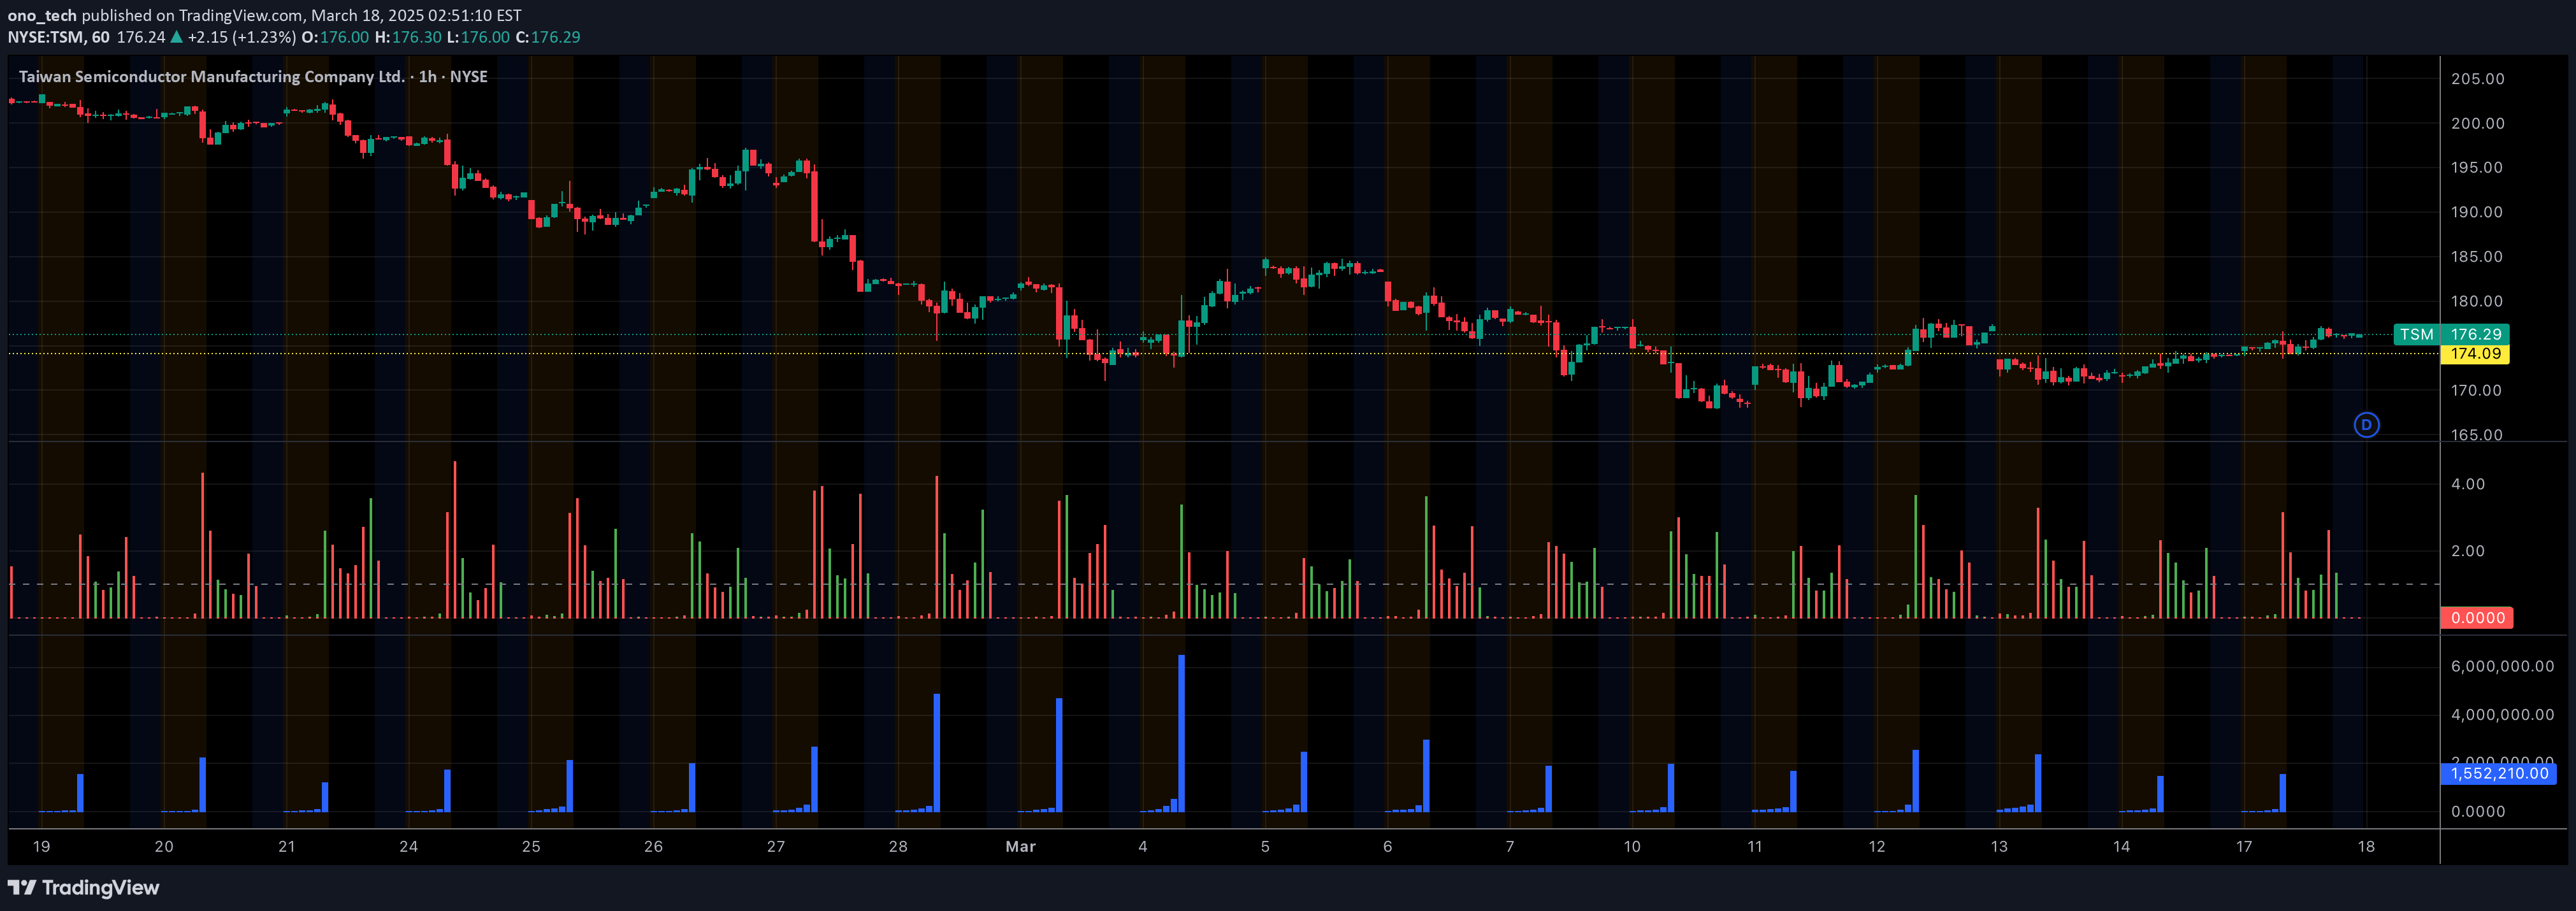
A candle chart visualization technique that uses color-coded volumes to represent price movement intensity, helping traders quickly understand trading volume dynamics.
Explore complementary indicator rolesHow it works
The volume-colored candle chart assigns specific colors to represent different volume levels for both upward and downward price movements. Traders can customize the percentage thresholds that define low, medium, and high volumes, allowing for personalized visual interpretation of trading intensity.
By implementing different colors for various volume ranges, the chart provides an immediate visual cue about the strength behind price movements. This color-coding helps traders quickly assess whether a price change is supported by significant trading volume or represents a potentially weaker market sentiment.
Why it may be useful
Volume-colored candle charts offer traders a rapid, intuitive method to understand market dynamics without complex calculations or additional indicators. By transforming raw volume data into an easily digestible color scheme, traders can make faster, more informed decisions about potential price trends and market momentum.
The visual representation allows traders to quickly distinguish between strong and weak price movements, potentially highlighting market sentiment shifts and providing early insights into possible trend reversals or continuations.
When to explore it
This volume visualization technique is most effective in volatile markets with significant price fluctuations where understanding volume dynamics becomes crucial for decision-making. It works particularly well for active traders who need to quickly assess market sentiment and trading intensity across various timeframes.
Traders should utilize this approach during periods of market uncertainty, when traditional volume indicators might require more complex interpretation. It is especially useful for day traders, scalpers, and swing traders who rely on quick visual assessments of market conditions.
Keep exploring
What we’ve verified
Access, alerts and repainting behaviour have not been independently verified for this indicator. Check the creator’s current publication and settings.
General descriptions and classifications are recovered research. Verified details above identify the specific checks we have completed. Check the creator’s current publication for later changes.