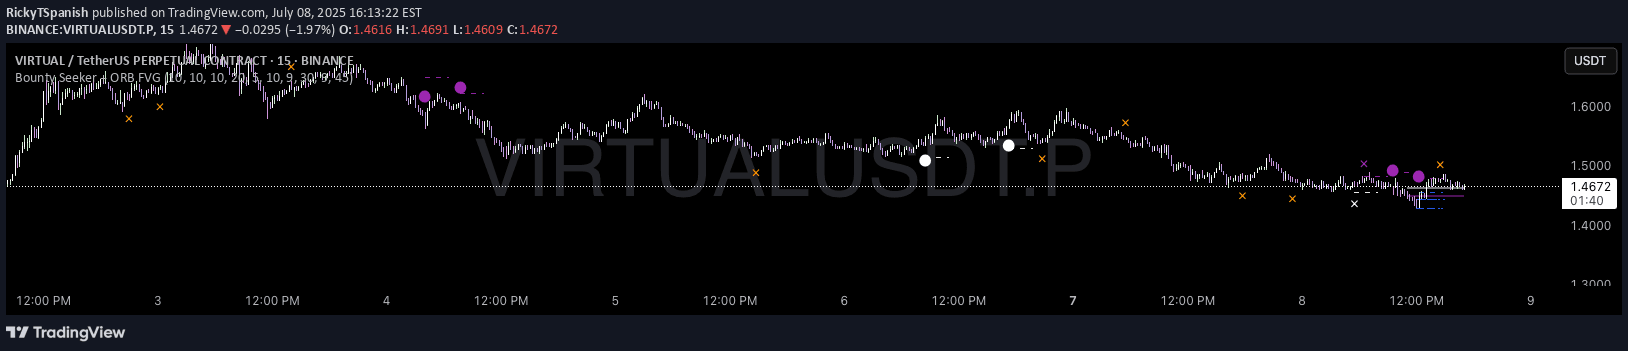
A powerful trading indicator combining Volume Profile and Order Block analysis to identify high-liquidity zones and potential trend reversals with customizable features.
Explore complementary indicator rolesHow it works
The Volume Profile Bar-Magnified Order Blocks indicator works by analyzing the trading volume across different price levels, creating a visual representation of market activity and liquidity. It maps out the volume distribution horizontally, highlighting areas where significant trading volume has occurred, which can indicate potential support and resistance zones.
The indicator also incorporates Strong Demands and Offers analysis, which identifies key points of buying and selling pressure. By examining these zones, traders can gain insights into potential trend reversals, market sentiment, and areas where price might react strongly. The advanced customization features allow traders to adjust the mitigation method and grid settings to suit their specific trading strategy.
Why it may be useful
This indicator is crucial for traders because it provides a deeper understanding of market dynamics beyond simple price movement. By visualizing volume distribution and identifying key order blocks, traders can make more informed decisions about potential entry and exit points. The detailed volume analysis helps traders understand where institutional or significant market participants are active.
The combination of Volume Profile and Order Block analysis offers a comprehensive view of market structure, enabling traders to identify high-probability trading opportunities. It helps traders assess market sentiment, liquidity, and potential price reaction zones, which can significantly improve trading precision and risk management strategies.
When to explore it
The Volume Profile Bar-Magnified Order Blocks indicator is most effective in markets with clear volume patterns and distinct trading ranges. It works best in liquid markets such as major forex pairs, stock indices, and heavily traded commodities where volume data provides meaningful insights. Traders should use this indicator when seeking to understand market structure and identify potential turning points.
This tool is particularly useful during periods of consolidation or when markets are transitioning between trending and ranging conditions. It can help traders spot areas of potential breakout, confirm trend strength, and make more precise trading decisions by highlighting zones of significant market activity and potential institutional interest.
Keep exploring
What we’ve verified
Access, alerts and repainting behaviour have not been independently verified for this indicator. Check the creator’s current publication and settings.
General descriptions and classifications are recovered research. Verified details above identify the specific checks we have completed. Check the creator’s current publication for later changes.