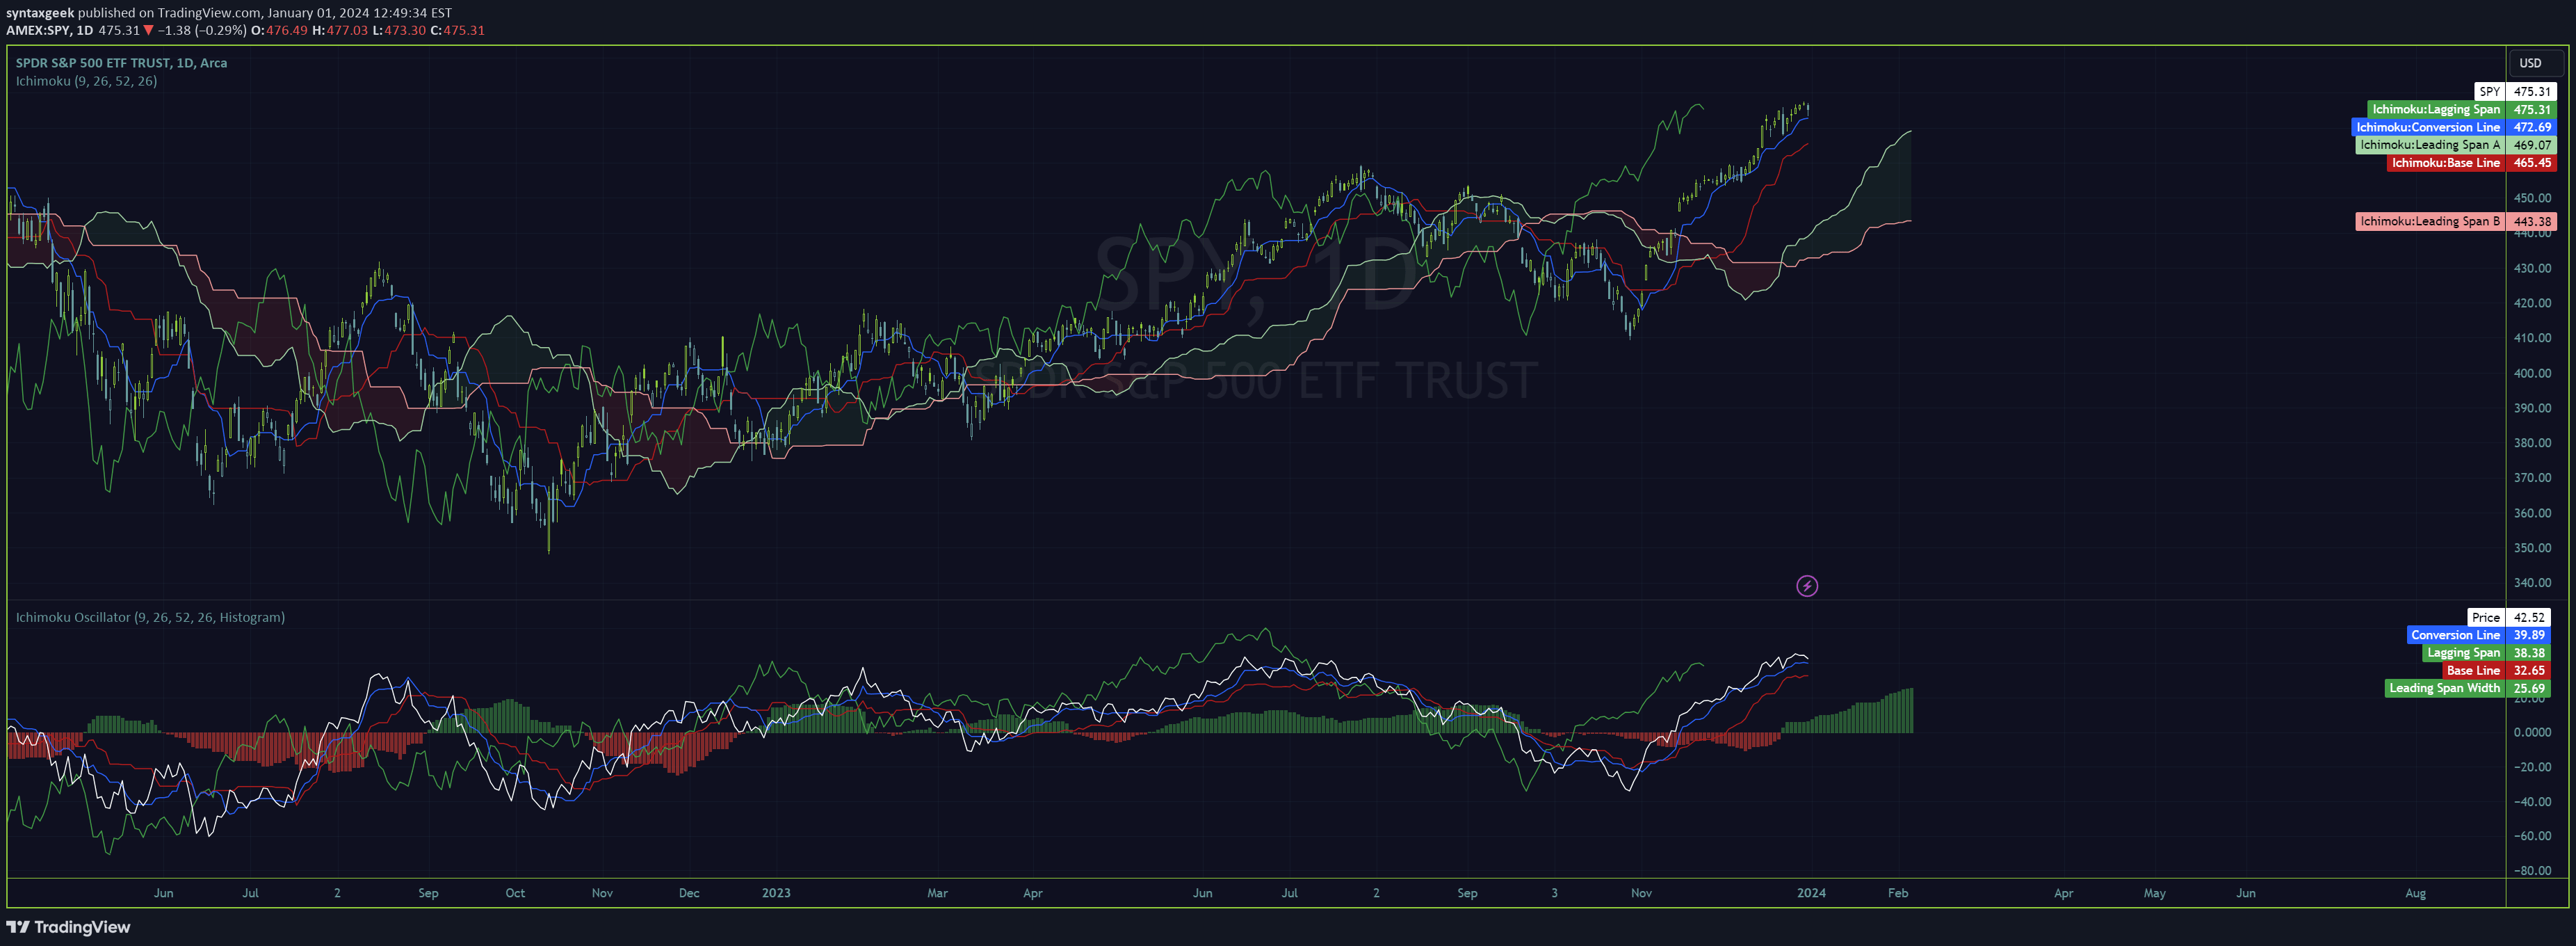
A technical analysis tool that identifies market trend reversals and overbought/oversold conditions using wave and kernel analysis to generate trading signals.
Explore complementary indicator rolesHow it works
The WaveTrendnel Oscillator operates by applying a rational quadratic kernel function to historical price data, assigning weighted importance to each data point based on its proximity to the current period. This mathematical approach enables a smoother and more accurate representation of market trends by analyzing price movements through a sophisticated kernel method.
Traders can customize parameters such as channel length, average length, and signal length to adapt the indicator to different market conditions and trading preferences. The oscillator generates signals by tracking these weighted price movements and identifying potential trend reversals through its unique wave and kernel analysis technique.
Why it may be useful
The WaveTrendnel Oscillator provides traders with a sophisticated tool for understanding market dynamics by offering insights into trend strength, potential reversals, and overbought/oversold conditions. By utilizing advanced mathematical techniques like the kernel method, the indicator offers a more nuanced view of price movements compared to traditional technical analysis tools.
Its customizable nature allows traders to fine-tune the indicator to their specific trading style and market environment, making it a versatile tool for identifying potential entry and exit points. The ability to set custom overbought and oversold levels further enhances its utility in helping traders make more informed trading decisions.
When to explore it
The WaveTrendnel Oscillator is most effective in markets with clear trending characteristics, where price movements show consistent directional momentum. It performs optimally in volatile markets where quick trend reversals and momentum shifts are common, such as cryptocurrency, forex, and active stock markets.
Traders should utilize this indicator in conjunction with other technical analysis tools to confirm signals and reduce false positives. It is particularly useful during periods of market uncertainty, when traditional indicators might provide conflicting or ambiguous information about potential trend changes.
Keep exploring
What we’ve verified
Access, alerts and repainting behaviour have not been independently verified for this indicator. Check the creator’s current publication and settings.
General descriptions and classifications are recovered research. Verified details above identify the specific checks we have completed. Check the creator’s current publication for later changes.