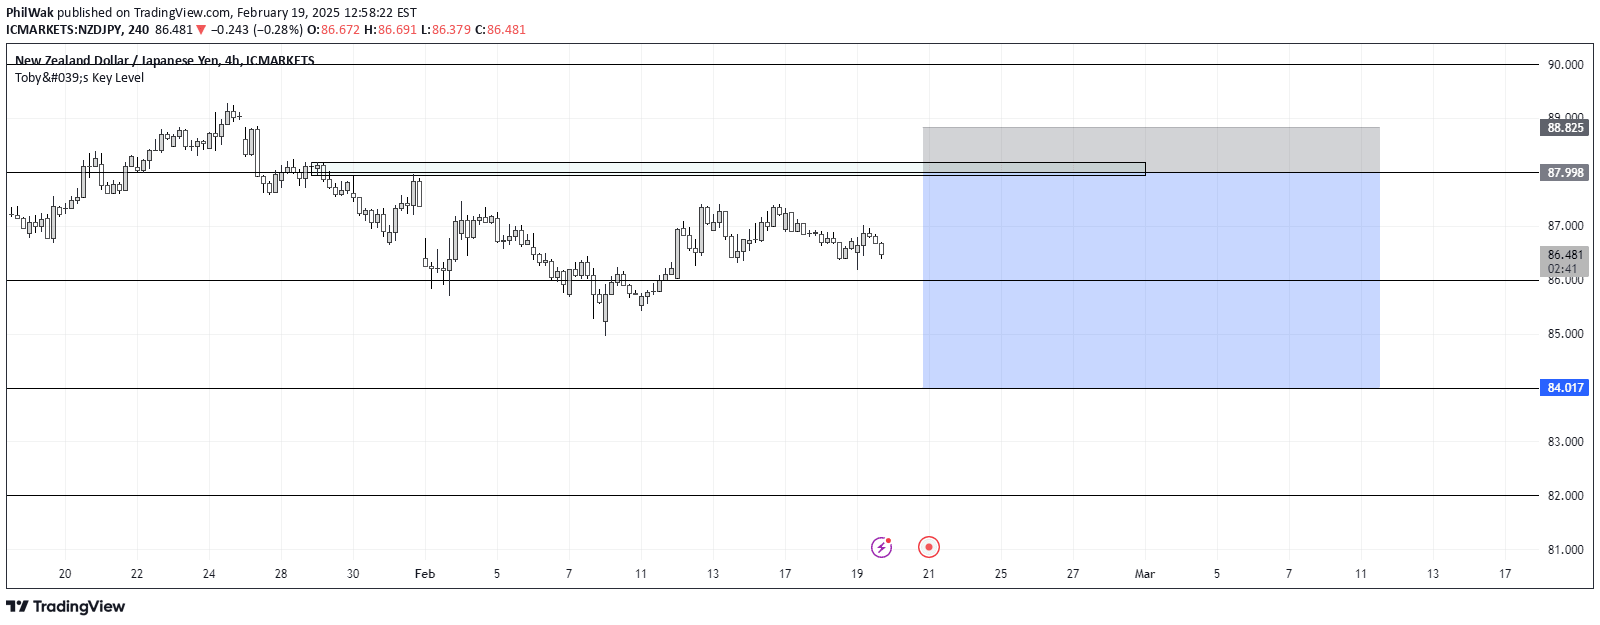
An advanced charting tool that automatically identifies and draws wedge patterns, helping traders detect potential price movement trends and projection ranges.
Explore complementary indicator rolesHow it works
This indicator identifies market patterns by tracking swing highs and swing lows across green and red price candles. It systematically analyzes price movements to detect converging trendlines that form wedge patterns, which are characterized by triangular or wedge-shaped price formations.
The tool calculates peak and trough prices, evaluates trend directions, and generates dynamic support and resistance levels. By drawing precise trendlines and projecting potential price ranges, traders can visually understand emerging market structures and potential breakout or breakdown scenarios.
Why it may be useful
Wedge pattern identification helps traders anticipate potential market reversals and continuation patterns with greater precision. By objectively mapping price movements and trend dynamics, the indicator provides a structured approach to understanding market psychology and potential future price actions.
The tool's ability to automatically detect and visualize complex price patterns reduces subjective interpretation and allows traders to make more informed decisions. It transforms abstract market movements into clear, actionable visual representations that can significantly enhance trading strategy and risk management.
When to explore it
This indicator works best in markets with clear trending behavior and sufficient price data, particularly in 24-hour markets with minimal price gaps. Traders should utilize it when seeking to identify potential breakout or breakdown opportunities across various timeframes and asset classes.
The tool is especially useful during periods of price consolidation, where converging trendlines suggest potential imminent price movements. Traders can leverage this indicator to set strategic entry and exit points, determine stop-loss levels, and project potential price targets based on the measured pattern ranges.
Keep exploring
What we’ve verified
Access, alerts and repainting behaviour have not been independently verified for this indicator. Check the creator’s current publication and settings.
General descriptions and classifications are recovered research. Verified details above identify the specific checks we have completed. Check the creator’s current publication for later changes.