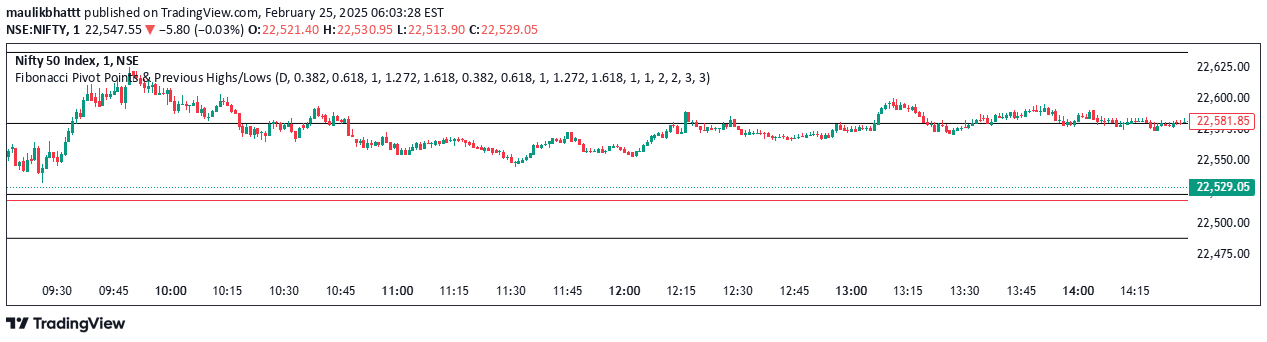
A TradingView indicator that color-codes trading days, highlights specific time ranges, and automatically marks intraday support and resistance levels.
Explore complementary indicator rolesHow it works
The indicator first assigns unique background colors to each trading day, allowing visual differentiation between Monday through Friday. It then focuses on a specific predefined time range, such as 18:15-18:30, tracking price movements during that window.
Within this time period, the script dynamically calculates the highest high and lowest low prices. Once the time range concludes, it automatically draws horizontal lines at these extreme price levels, which can extend forward as potential support and resistance references.
Why it may be useful
This indicator provides traders with enhanced visual context by color-coding trading days and highlighting specific time periods. The color-coding helps quickly distinguish between different days, while the time range tracking offers insights into intraday price dynamics.
By automatically marking session highs and lows, the indicator simplifies the process of identifying key support and resistance levels. Traders can quickly recognize critical price points without manually drawing lines, potentially improving trade entry and exit decision-making.
When to explore it
The indicator is most effective for traders focusing on intraday price movements and specific market sessions. It works particularly well for those who track consistent time ranges like market opens, closes, or specific trading windows where significant price action occurs.
Traders who value visual organization and want to quickly identify daily price extremes will find this tool most useful. It is especially beneficial for day traders and scalpers who rely on short-term price dynamics and need quick, clear visual representations of market behavior.
Keep exploring
What we’ve verified
Access, alerts and repainting behaviour have not been independently verified for this indicator. Check the creator’s current publication and settings.
General descriptions and classifications are recovered research. Verified details above identify the specific checks we have completed. Check the creator’s current publication for later changes.