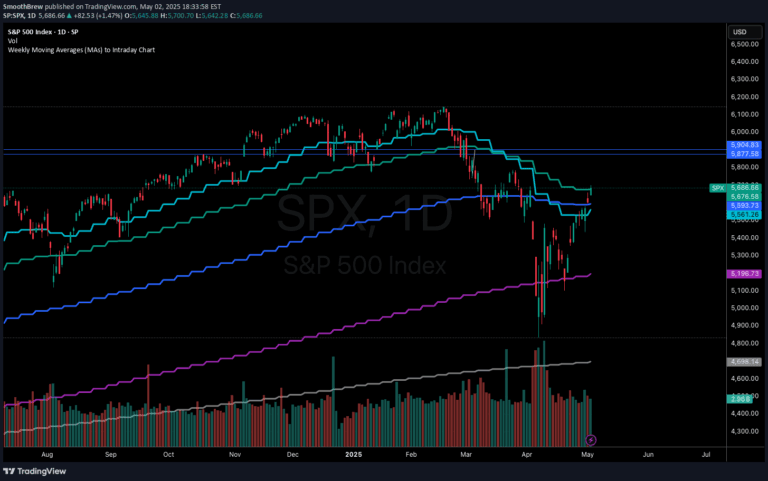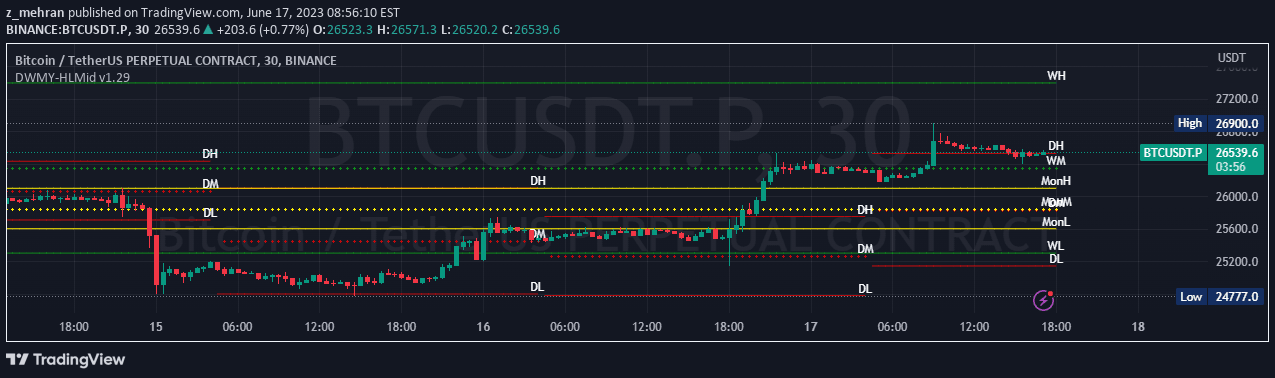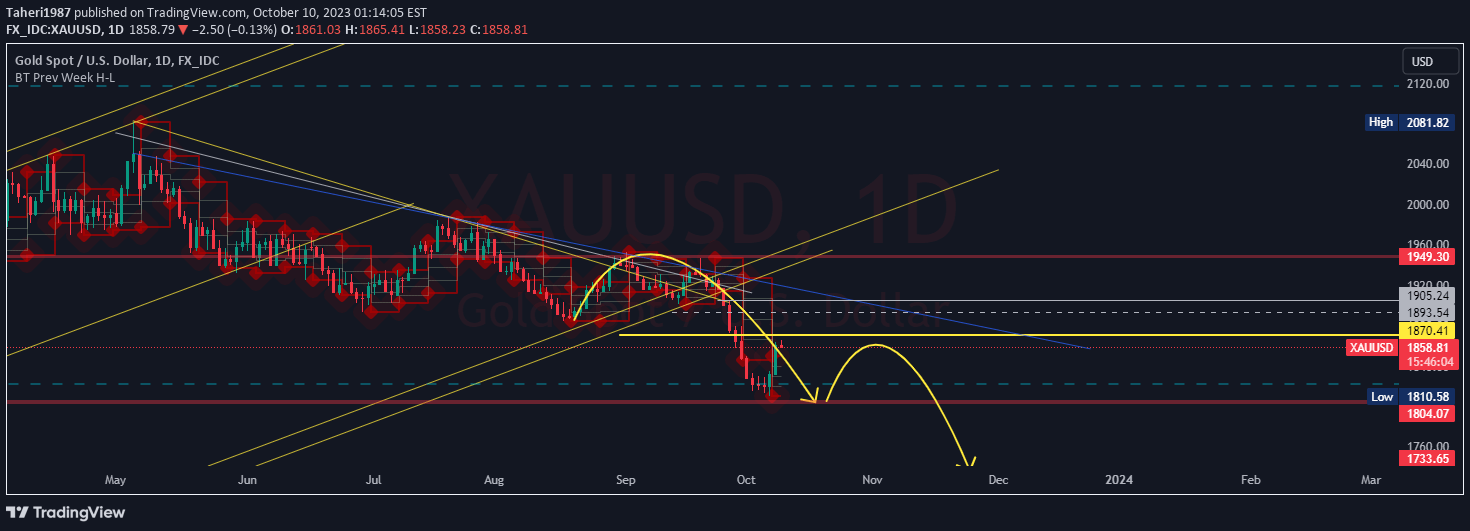
A weekly chart indicator that plots low and high price levels and divides them into specific percentage zones, helping traders identify key price levels and potential trading opportunities.
Explore complementary indicator rolesHow it works
The weekly map indicator captures the weekly high and low prices of a financial instrument and breaks these levels into predetermined percentage segments. These segments create visual reference points that help traders understand price range dynamics and potential support or resistance zones. By dividing the weekly price range into specific percentages, traders can more easily interpret price movements and potential turning points.
The indicator operates by first identifying the highest and lowest prices of the weekly candle, then mathematically segmenting this range into proportional levels. These levels can be used to assess where current price action sits relative to the overall weekly range, providing insights into market strength, weakness, and potential directional bias.
Why it may be useful
Weekly map indicators are crucial for traders seeking a structured approach to understanding price range dynamics and market sentiment. By providing a clear visual representation of price levels, traders can make more informed decisions about entry and exit points, risk management, and potential trend reversals. The percentage-based segmentation offers a standardized method of analyzing price movement beyond traditional support and resistance techniques.
Moreover, this indicator helps traders contextualize current price action within the broader weekly timeframe. It allows for a more strategic view of market movements, helping traders identify potential turning points, assess momentum, and develop more disciplined trading strategies based on objective price range analysis.
When to explore it
The weekly map indicator is most effective in markets with clear trending characteristics and sufficient weekly price range volatility. It works best for swing traders who are interested in capturing multi-day to multi-week price movements and want a structured approach to analyzing market dynamics. Traders should use this indicator in conjunction with other technical analysis tools to confirm signals and improve decision-making.
Optimal usage occurs in liquid markets with consistent weekly trading patterns, such as major forex pairs, large-cap stocks, and prominent index futures. Traders should pay special attention to how price interacts with these percentage-based levels, using them as potential entry, exit, or stop-loss points. The indicator is particularly valuable during periods of market transition or when seeking to understand underlying trend strength.
Keep exploring
What we’ve verified
Access, alerts and repainting behaviour have not been independently verified for this indicator. Check the creator’s current publication and settings.
General descriptions and classifications are recovered research. Verified details above identify the specific checks we have completed. Check the creator’s current publication for later changes.