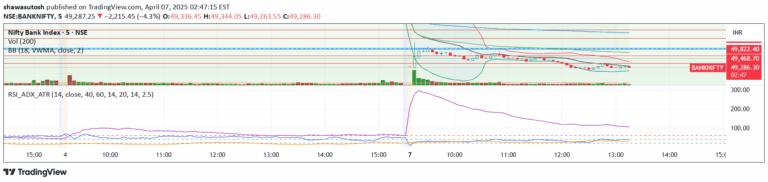
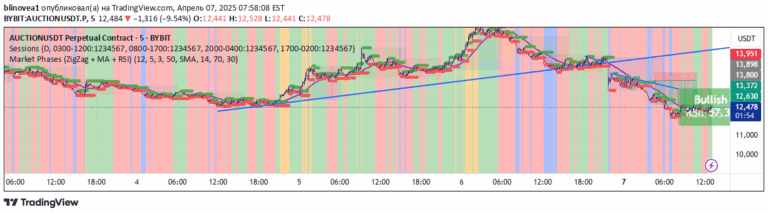
The White Noise indicator visualizes price movement dispersion around a moving average, revealing market volatility and potential trend shifts through color-coded columns and smoothed lines.
Explore complementary indicator rolesHow it works
The White Noise indicator calculates the percentage distance between price and a moving average, then smooths these values using weighted moving averages. It generates color-coded columns representing price dispersion, with variations in color indicating the strength and direction of market movements.
By comparing the current dispersion values against smoothed historical values, the indicator creates a visual representation of market noise. The colored columns and lines help traders understand how prices deviate from the average, with different colors signaling potential changes in market sentiment and trend direction.
Why it may be useful
The White Noise indicator provides traders with a nuanced view of market dynamics by revealing hidden volatility and trend potential beyond simple price movements. It helps identify periods of increased market uncertainty and potential trend reversals, offering insights that might be missed by traditional price analysis.
By transforming complex price dispersion data into intuitive visual signals, the indicator allows traders to make more informed decisions. The color-coded representation enables quick interpretation of market conditions, helping traders assess the strength of price movements and potential trend changes with greater clarity.
When to explore it
The White Noise indicator is most effective on longer timeframes, particularly daily (1D) charts or higher, where market noise and trend dynamics become more apparent. It works best in markets with clear trending characteristics, helping traders identify potential trend shifts and periods of increased volatility.
Traders should use this indicator in conjunction with other technical analysis tools to confirm signals and reduce false positives. It is particularly useful during market transitions, helping to distinguish between temporary price fluctuations and genuine trend changes across various financial instruments and asset classes.
Keep exploring
What we’ve verified
Access, alerts and repainting behaviour have not been independently verified for this indicator. Check the creator’s current publication and settings.
General descriptions and classifications are recovered research. Verified details above identify the specific checks we have completed. Check the creator’s current publication for later changes.