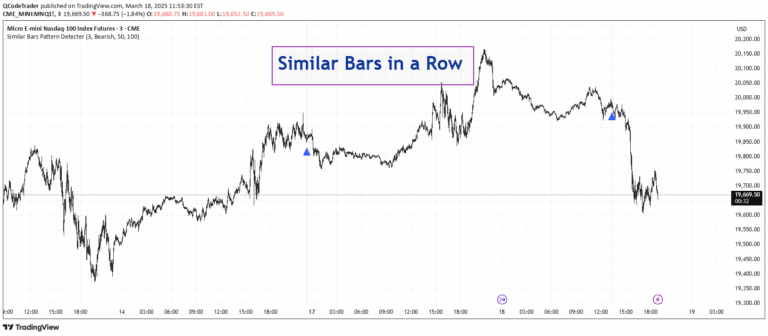
A trading indicator that analyzes candle wicks and bodies to reveal market pressure and potential trend changes by comparing Average True Bodies (ATBs) and Average True Wicks (ATWs).
Explore complementary indicator rolesHow it works
The indicator calculates Average True Bodies (ATBs) and Average True Wicks (ATWs) to visualize market dynamics and pressure. By comparing the relative sizes of candle wicks and bodies, it creates a dynamic representation of market sentiment and potential inflection points.
When wicks are larger than bodies, the indicator displays skinny, wick-like columns, signaling potential market uncertainty or significant price rejection. Conversely, when bodies dominate, thicker columns appear, suggesting stronger directional momentum and more decisive price action.
Why it may be useful
This indicator provides traders with a nuanced view of market sentiment by revealing the underlying dynamics of price movements beyond traditional candlestick analysis. It helps identify potential trend changes, market pressure, and areas of potential reversal by highlighting the relationship between candle wicks and bodies.
By distinguishing between periods of market uncertainty and decisive price action, traders can gain insights into potential entry and exit points. The visual representation helps traders quickly assess market psychology and make more informed trading decisions.
When to explore it
The indicator is most effective in volatile markets with significant price movements and potential trend reversals. It works best when analyzing shorter timeframes where price action and market sentiment can change rapidly, making it particularly useful for scalping and day trading strategies.
Traders should use this indicator in conjunction with other technical analysis tools to confirm signals and validate potential trade setups. It is especially valuable when looking for inflection points, stop hunts, and areas of potential liquidity where market dynamics might shift.
Keep exploring
What we’ve verified
Access, alerts and repainting behaviour have not been independently verified for this indicator. Check the creator’s current publication and settings.
General descriptions and classifications are recovered research. Verified details above identify the specific checks we have completed. Check the creator’s current publication for later changes.