
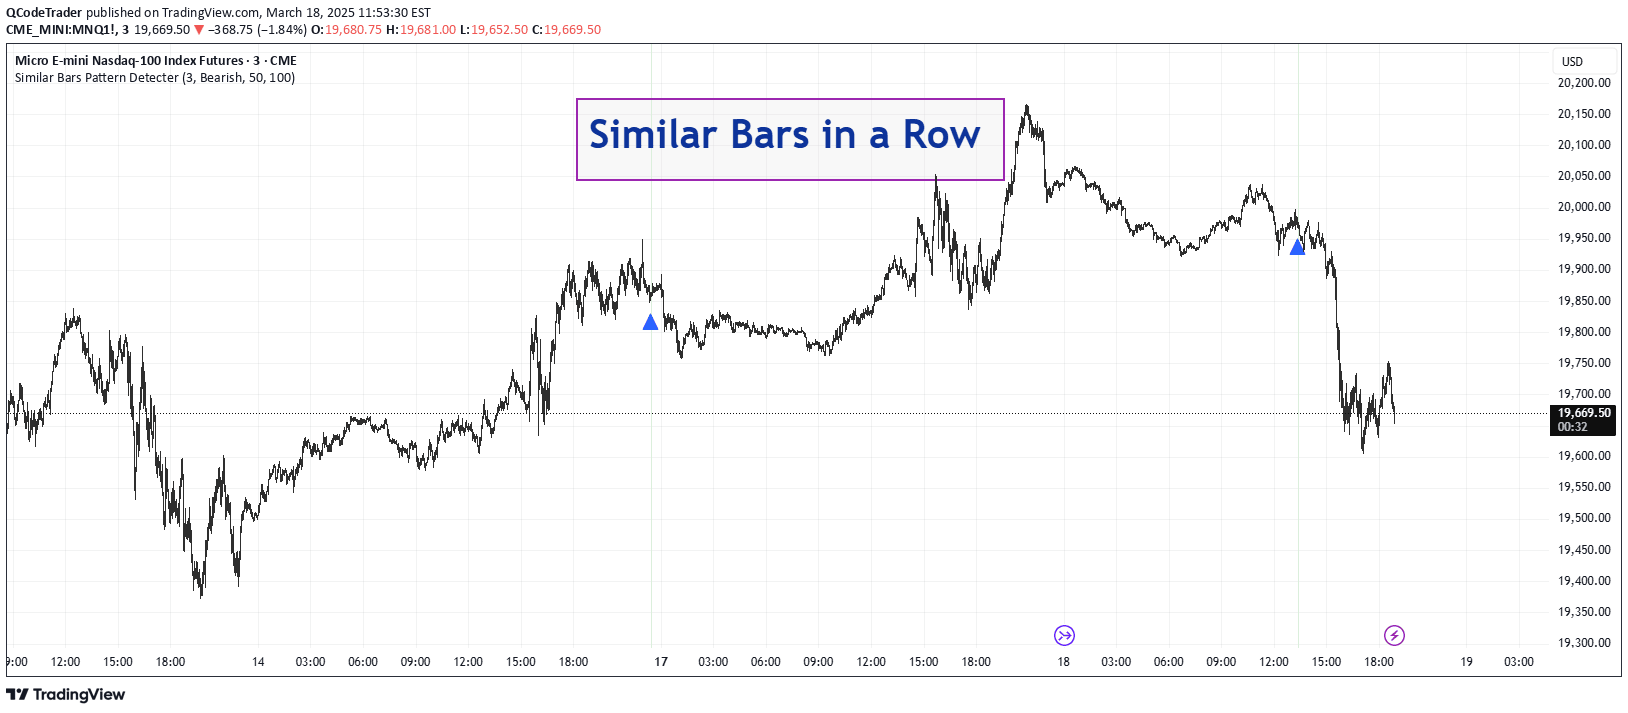
A professional Pine Script indicator for detecting consecutive similar candlestick patterns, helping traders identify trend repetitions and potential market movements across different timeframes.
Explore complementary indicator rolesHow it works
The Similar Bars Pattern Detector analyzes consecutive candlesticks by comparing their characteristics using tick-based range filtering. Traders can set parameters like number of candles and trend direction to customize pattern detection. The indicator scans price action and identifies sequences where bars share similar structural properties.
It calculates similarity based on predefined criteria such as body size, color, and relative positioning. The tool then highlights detected patterns directly on the chart for easy visualization. By comparing multiple bars simultaneously, it helps traders recognize potentially repeating market behaviors
Why it may be useful
Pattern recognition is crucial for understanding market dynamics and potential future price movements. This indicator provides traders with a systematic approach to identifying recurring candlestick formations. By highlighting similar bar sequences, it helps traders confirm existing trends or anticipate potential reversals.
The tool reduces subjective interpretation by offering an objective, algorithmic method of pattern detection. Traders can gain insights into market psychology and improve their decision-making process. The customizable nature allows adaptation to different trading styles and market conditions. Ultimately, it enhances traders' ability to make more informed and data-driven trading decisions
When to explore it
The Similar Bars Pattern Detector works best in markets with consistent price action and predictable trends. It is most effective when applied to liquid markets like forex, stocks, and cryptocurrencies. Traders should use this indicator during periods of stable market conditions with clear directional movements.
It proves particularly useful in identifying trend continuations and potential reversal points. The tool is most reliable when combined with other technical analysis methods and confirmation signals. Optimal usage includes applying it across multiple timeframes to validate pattern consistency. Traders should adjust settings based on specific market characteristics and their individual trading strategy
Keep exploring
What we’ve verified
Access, alerts and repainting behaviour have not been independently verified for this indicator. Check the creator’s current publication and settings.
General descriptions and classifications are recovered research. Verified details above identify the specific checks we have completed. Check the creator’s current publication for later changes.





