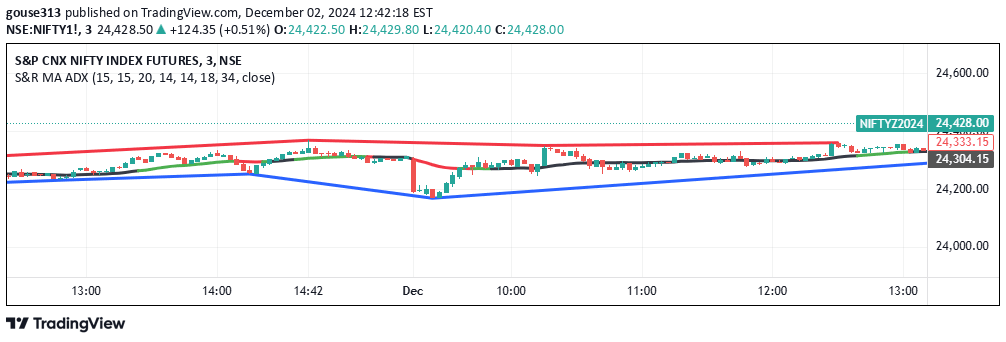
A trading signal using three Exponential Moving Averages (EMA9, EMA20, EMA50) to identify potential trend movements and entry points based on specific price and directional conditions.
Explore complementary indicator rolesHow it works
The indicator operates by analyzing the relationship between three Exponential Moving Averages: EMA9, EMA20, and EMA50. It focuses on the interaction between the shorter-term EMA9 and the medium-term EMA20, tracking their relative positions and distances. When EMA9 crosses or approaches EMA20 within a specific range (30 ticks), and both EMAs show directional movement (with a difference of up to 15 ticks), the signal is triggered.
The system then applies color-coding to visualize the trend: green when EMA9 is above EMA20, and red when EMA9 is below EMA20. Additionally, the indicator evaluates candle strength by examining shadow lengths, ensuring the candles meet specific criteria for minimal shadow sizes depending on whether they are bullish or bearish.
Why it may be useful
This trading signal provides traders with a dynamic and visually intuitive method to identify potential trend changes and entry points. By using multiple moving averages, it offers a more nuanced view of market momentum compared to single-indicator approaches. The color-coded system allows traders to quickly assess market sentiment and potential directional shifts.
The additional candle strength criteria help filter out low-quality signals, reducing the likelihood of false entries. This approach combines trend analysis with candlestick pattern recognition, giving traders a more comprehensive tool for making informed trading decisions across different timeframes and market conditions.
When to explore it
The signal is most effective in markets with clear trending characteristics, particularly in short to medium-term timeframes like scalping and day trading. It works best in liquid markets with consistent price movements, such as major forex pairs, stock indices, and highly traded commodities. The EMA-based approach is particularly useful during periods of moderate market volatility.
Traders should be cautious during extremely volatile or range-bound market conditions, where moving average signals might generate more false positives. The indicator is most reliable when used in conjunction with other technical analysis tools and fundamental market insights. It is particularly suited for traders who prefer a systematic, trend-following approach to market analysis.
Keep exploring
What we’ve verified
Access, alerts and repainting behaviour have not been independently verified for this indicator. Check the creator’s current publication and settings.
General descriptions and classifications are recovered research. Verified details above identify the specific checks we have completed. Check the creator’s current publication for later changes.