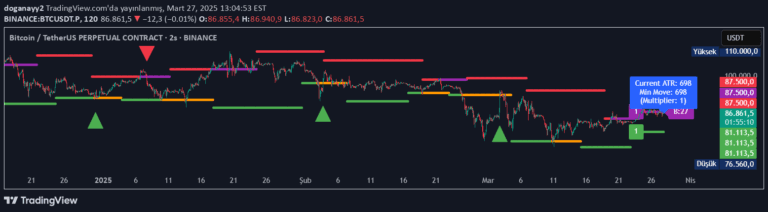
An hourly opening range indicator that tracks price action within individual sessions, highlighting potential trading opportunities through range breakouts and key support/resistance levels.
Explore complementary indicator rolesHow it works
The indicator defines the first bar of each hourly session as the opening range (OR), recording its high and low prices. Throughout the session, it dynamically updates these levels in real-time, capturing price volatility and creating a visual background box to highlight the range.
As the session progresses, the range extends, maintaining the initial box on the chart. This allows traders to see price action relative to the original opening range, tracking whether price is trading inside, breaking above, or breaking below the established levels.
Why it may be useful
The opening range indicator provides crucial market structure and context for traders by transforming abstract price movements into clear, visually identifiable zones. It helps traders quickly understand market dynamics, potential momentum shifts, and key decision points within each trading session.
By offering a systematic approach to analyzing intraday price action, the indicator reduces emotional decision-making and provides objective reference points for potential trade entries, stop placements, and target levels across different market conditions.
When to explore it
This indicator works best during active trading hours with consistent liquidity, particularly around major market session overlaps like London and New York opens. It is most effective in markets with clear intraday directional movements and sufficient trading volume.
Traders should apply this tool in markets that exhibit predictable hourly behavior, such as forex, futures, or heavily traded stocks. It is particularly useful for traders seeking to understand short-term market structure and identify potential breakout or mean reversion opportunities within each trading session.
Keep exploring
What we’ve verified
Access, alerts and repainting behaviour have not been independently verified for this indicator. Check the creator’s current publication and settings.
General descriptions and classifications are recovered research. Verified details above identify the specific checks we have completed. Check the creator’s current publication for later changes.