
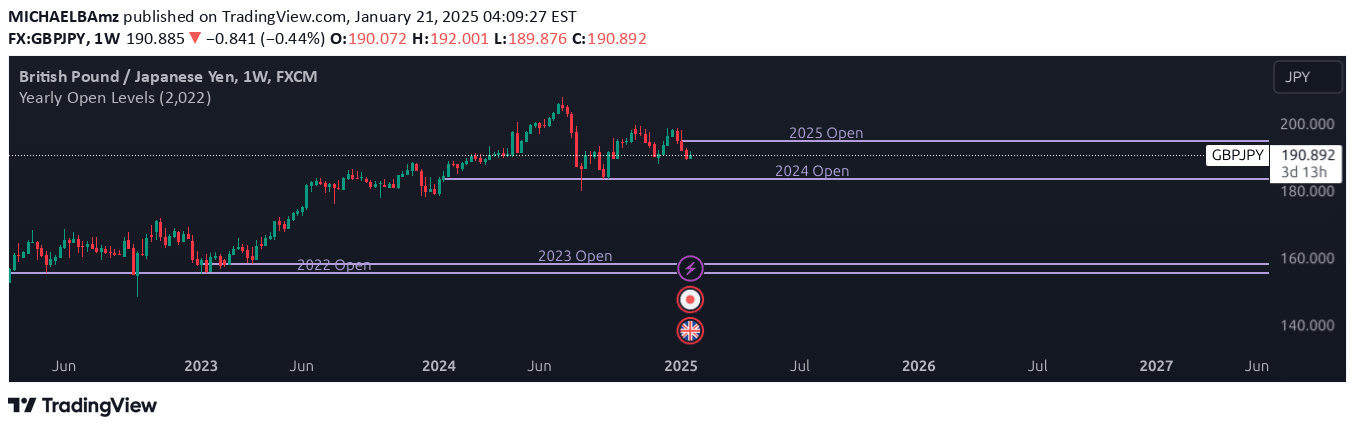
A trading indicator that automatically displays and tracks the opening price levels for each year, helping traders visualize annual price reference points across different market charts.
Explore complementary indicator rolesHow it works
The Yearly Open Levels indicator calculates the opening price for each year based on a user-defined starting point. It generates horizontal lines extending across the chart, marking the precise price point where each year begins, with customizable start years and color options.
Traders can set a specific initial year, allowing the indicator to automatically plot and label these annual opening levels. The lines remain consistent throughout the year, providing a clear visual reference for comparing current price movements against the year's initial trading level.
Why it may be useful
Yearly Open Levels provide traders with a critical macro perspective on price movements, offering a consistent benchmark for evaluating annual market performance. By displaying the exact opening price, traders can quickly assess whether current prices are trading above or below the year's initial level, which can indicate broader market sentiment and trend strength.
These levels serve as important psychological and strategic reference points, helping traders understand long-term market dynamics and make more informed trading decisions. The visual representation allows for quick interpretation of annual price context without requiring complex calculations.
When to explore it
The Yearly Open Levels indicator is most beneficial for swing traders and investors focusing on longer-term market trends and annual performance analysis. It works exceptionally well when examining markets with clear directional movements and when seeking to understand broader market context beyond daily or weekly fluctuations.
Traders can utilize this indicator across various financial instruments, including stocks, indices, commodities, and forex, to gain insights into yearly price benchmarks. It is particularly useful during periods of market transition or when assessing the overall health of a particular trading instrument.
Keep exploring
What we’ve verified
Access, alerts and repainting behaviour have not been independently verified for this indicator. Check the creator’s current publication and settings.
General descriptions and classifications are recovered research. Verified details above identify the specific checks we have completed. Check the creator’s current publication for later changes.


