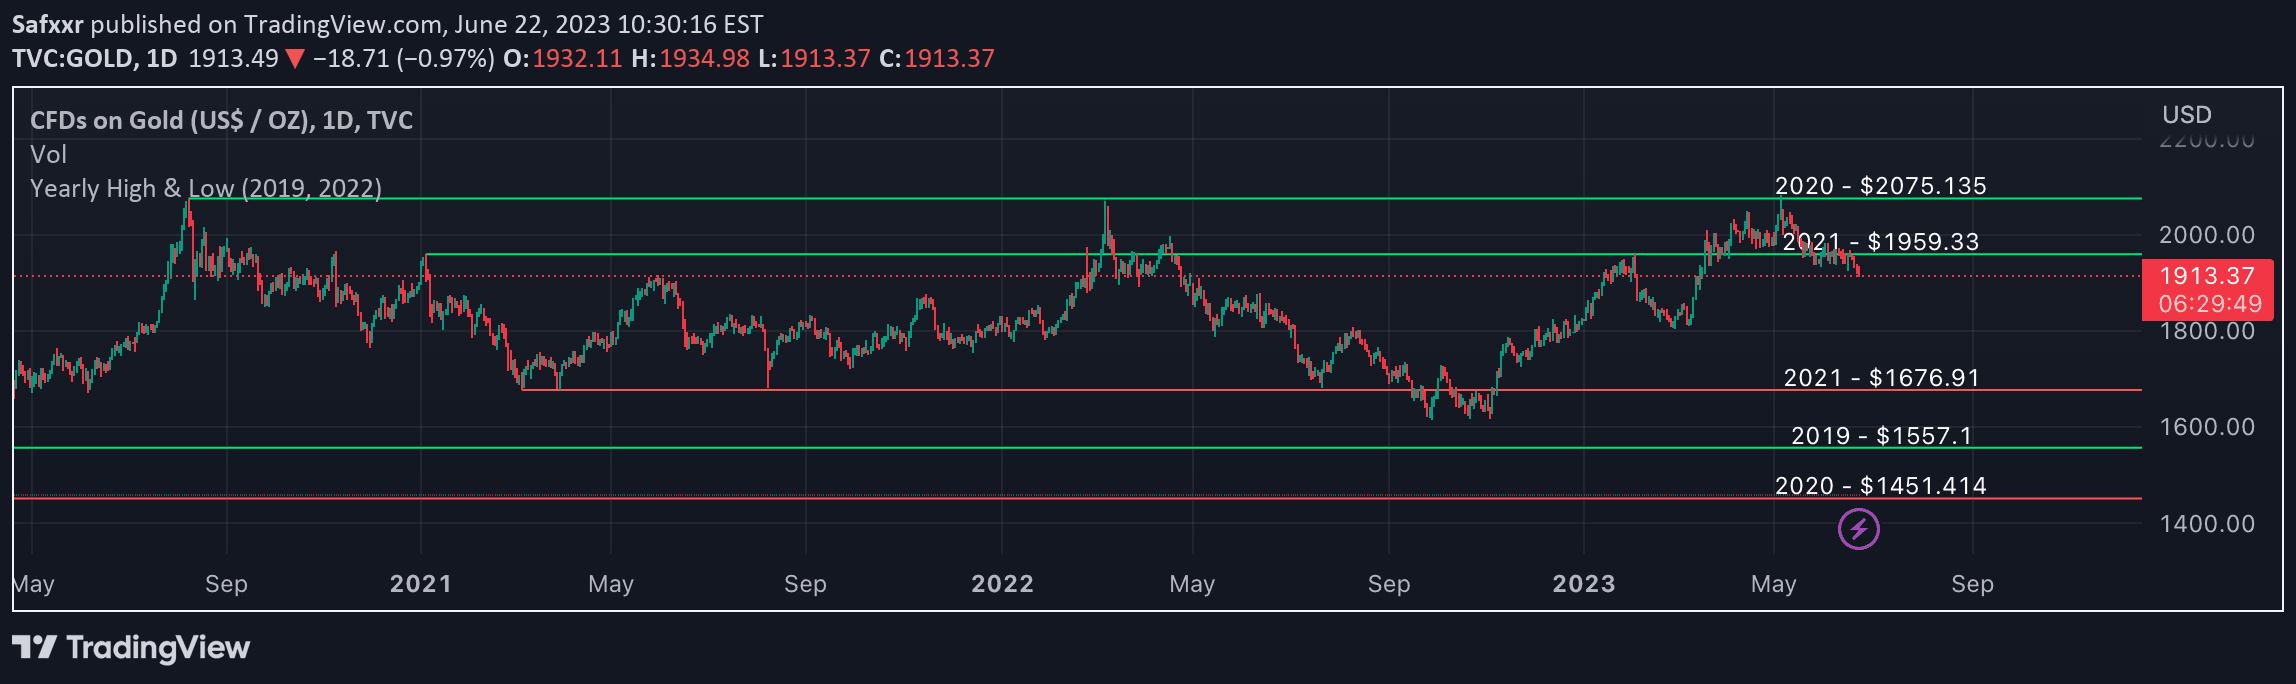
A custom TradingView indicator that plots yearly open price levels on a chart, helping traders identify key support and resistance zones across different market years.
Explore complementary indicator rolesHow it works
The indicator automatically calculates and plots a single horizontal line representing the opening price for each specific year on the trading chart. Each line is color-coded and labeled with its corresponding year and exact open price, making it easy for traders to visually track significant price levels.
By analyzing these yearly open price lines, traders can observe how current price action relates to historical yearly starting points. The script allows customization of parameters like starting year and line color, providing flexibility in visualizing long-term price trends and potential support/resistance zones.
Why it may be useful
Yearly open price levels provide crucial context for understanding market structure and potential turning points in price action. These levels represent significant psychological and fundamental reference points that can influence trader behavior and market sentiment across different timeframes.
By revealing how current prices interact with historical yearly opens, traders can gain insights into broader market trends, potential trend reversals, and key support/resistance zones. This perspective helps traders make more informed decisions by connecting short-term price movements with longer-term market dynamics.
When to explore it
This indicator is most effective in markets with clear yearly cycles and significant price movements, such as stocks, futures, forex, and cryptocurrencies. Traders can benefit from using this tool when analyzing longer-term trends and seeking to understand broader market structure beyond daily or weekly price action.
The yearly open price levels are particularly useful during periods of market transition, potential trend reversals, or when assessing overall market sentiment. Traders should combine this indicator with other technical analysis tools to confirm signals and develop more comprehensive trading strategies.
Keep exploring
What we’ve verified
Access, alerts and repainting behaviour have not been independently verified for this indicator. Check the creator’s current publication and settings.
General descriptions and classifications are recovered research. Verified details above identify the specific checks we have completed. Check the creator’s current publication for later changes.