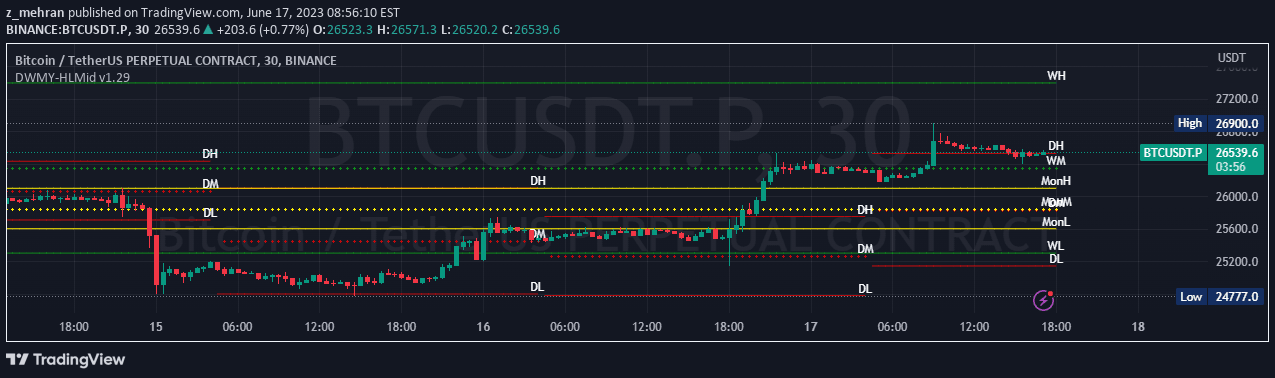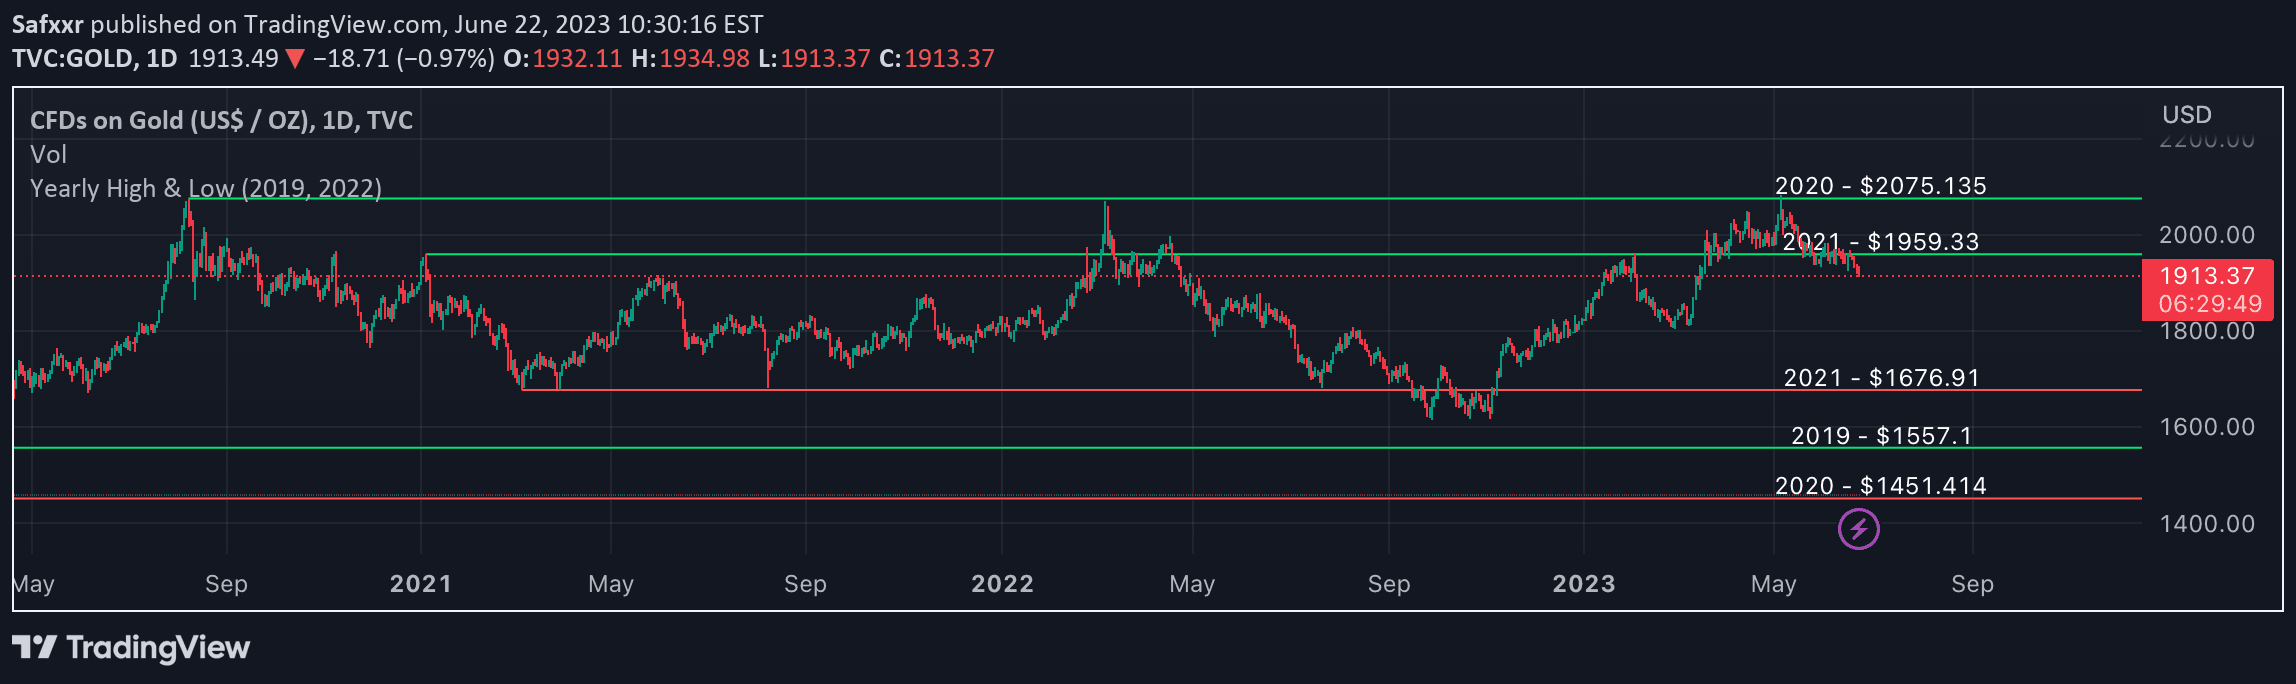
A chart indicator that displays yearly high and low price levels, helping traders identify key price ranges and potential support and resistance areas for strategic trading decisions.
Explore complementary indicator rolesHow it works
The Yearly High & Low indicator automatically tracks and plots the highest and lowest price points for each specified year on the trading chart. It uses historical price data to draw horizontal lines representing the maximum and minimum price levels reached during each annual period.
Traders can customize the indicator by selecting specific start and end years, adjusting line colors, and toggling the visibility of high and low price markers. The lines remain static on the chart, providing a consistent reference point for price movement and potential market psychology.
Why it may be useful
Understanding yearly high and low price levels helps traders identify significant market support and resistance zones based on historical price performance. These levels provide critical insights into potential trend reversals, market sentiment, and long-term price behavior across different market cycles.
By visualizing these key price points, traders can make more informed decisions about entry and exit points, set more strategic stop-loss and take-profit levels, and gain a broader perspective on market dynamics beyond shorter-term price fluctuations.
When to explore it
The Yearly High & Low indicator is most effective when analyzing markets with clear historical price trends and when seeking to understand long-term price behavior. It is particularly useful for traders who want to identify potential trend reversal points or assess the overall market structure across different timeframes.
This indicator works best in relatively stable markets with consistent price movements, such as major stock indices, currency pairs, and established commodities. Traders should combine this tool with other technical and fundamental analysis methods to validate trading decisions and enhance overall market understanding.
Keep exploring
What we’ve verified
Access, alerts and repainting behaviour have not been independently verified for this indicator. Check the creator’s current publication and settings.
General descriptions and classifications are recovered research. Verified details above identify the specific checks we have completed. Check the creator’s current publication for later changes.