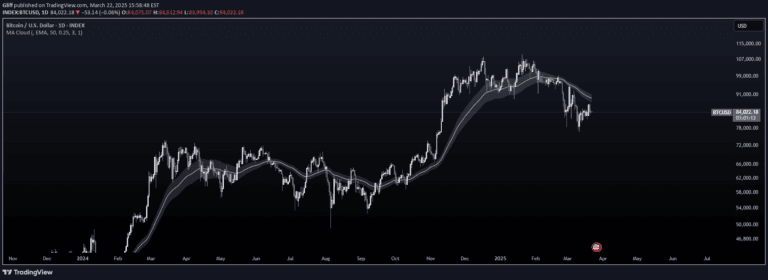
A unique Bollinger Band variant built on zigzag pivots, providing a comprehensive view of price movement relative to historical trend and volatility ranges.
Explore complementary indicator rolesHow it works
This indicator calculates a moving average of zigzag pivots as its central line, with adjacent lines representing pivot high and low moving averages. It then extends upper and lower Bollinger Bands using standard deviation from these moving averages.
The bands are constructed using two standard deviations, creating multiple lines that visualize price movement complexity. Outermost lines represent the extreme Bollinger Bands derived from pivot high and low moving averages. This multi-layered approach allows traders to see price positioning within its historical context
Why it may be useful
By integrating zigzag pivot analysis with Bollinger Bands, this indicator provides a more nuanced view of market dynamics than traditional indicators. It helps traders understand price movement relative to recent trend patterns, offering insights into potential trend strength and volatility.
The multiple lines and cloud formation enable quick visual assessment of price positioning. Traders can quickly identify whether current price is trending, consolidating, or potentially reversing. This comprehensive view supports more informed trading decisions and risk management strategies
When to explore it
This indicator works best in markets with clear trend characteristics and moderate volatility. It is particularly useful for swing traders seeking to understand price positioning within broader market movements. Traders should apply it on timeframes that capture meaningful pivot points, typically daily or weekly charts.
It performs well in trending markets where price has discernible high and low pivot points. Cryptocurrency, forex, and stock markets with sufficient liquidity are ideal. Traders should combine this indicator with other confirmation signals for robust trading strategies
Keep exploring
What we’ve verified
Access, alerts and repainting behaviour have not been independently verified for this indicator. Check the creator’s current publication and settings.
General descriptions and classifications are recovered research. Verified details above identify the specific checks we have completed. Check the creator’s current publication for later changes.