ICT Premium/Discount
A custom indicator for marking Premium and Discount price zones with configurable range settings and focused trading analysis using ICT concepts.
Explore 11,183 indicators. Filter beyond the obvious.
Discover the tools that fit the way you trade.
11,183 tools to explore
A custom indicator for marking Premium and Discount price zones with configurable range settings and focused trading analysis using ICT concepts.
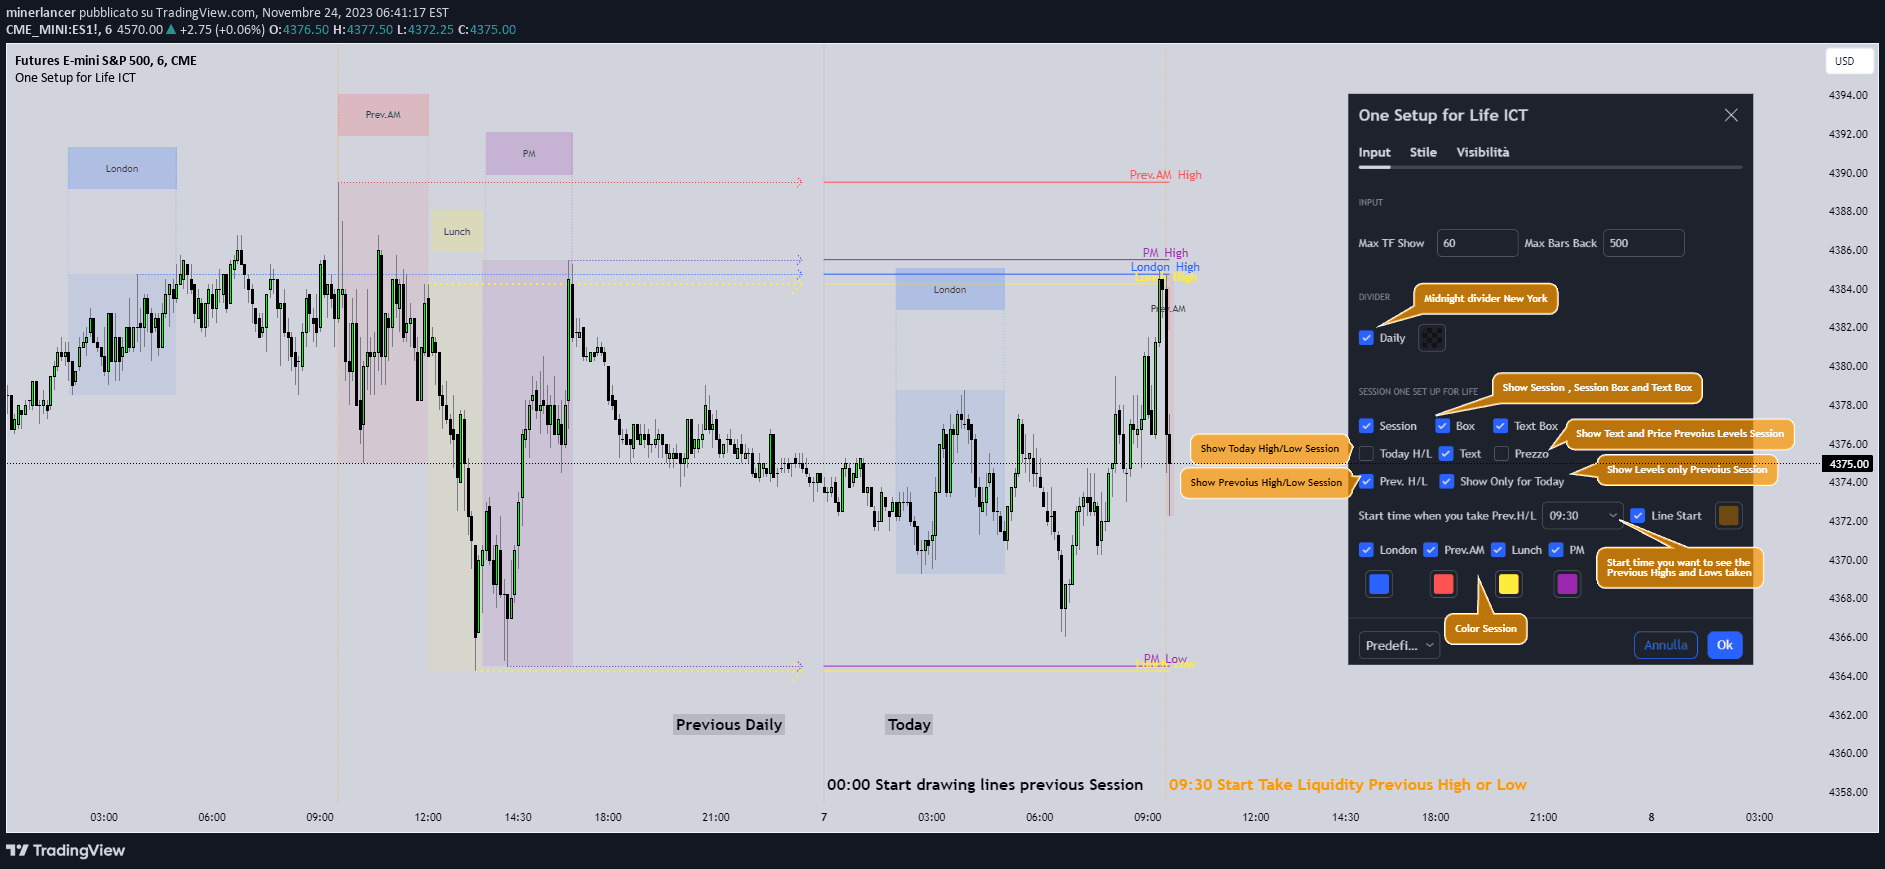
A trading indicator that analyzes session highs and lows, providing strategic entry and exit points based on previous market sessions and specific time frames.
A versatile trading indicator that divides market sessions into four quarters, analyzing price behavior and potential market movements across different trading timeframes.
A custom BIAS indicator that evaluates market momentum by comparing the previous two closed candles' price levels to determine potential trend continuation.
A MACRO time-based Fair Value Gap indicator that helps traders identify potential price movements and liquidity zones by analyzing interbank price controls and market dynamics.
A versatile trading indicator that calculates potential price levels before and after a start point, offering flexible visualization of market highs, lows, and price movements.
A trading indicator that tracks liquidity creation and elimination across different market sessions, helping traders identify potential reversal points and trading opportunities.
An ICT-inspired indicator that analyzes price spikes and shadows using Fibonacci levels to identify potential trading opportunities across multiple timeframes.
A support and resistance indicator that displays custom zones and breakout levels, allowing traders to identify key price levels and potential market movements with configurable settings.
A specialized indicator that analyzes price spikes and shadows using Fibonacci levels to identify potential market continuation or reversal zones with customizable settings.
A Pine Script tool that helps traders calculate precise position sizes and manage risk by visualizing trade entry, stop loss, and take profit levels on their trading chart.
Likes, views, and comments are historical TradingView snapshots. They describe attention, not trading performance.