Multi-Timeframe Trend Lines
A multi-timeframe trend indicator that shows market direction across different time periods using color-coded slanted lines to help traders understand trend strength and direction.
Explore 11,183 indicators. Filter beyond the obvious.
Discover the tools that fit the way you trade.
11,183 tools to explore
A multi-timeframe trend indicator that shows market direction across different time periods using color-coded slanted lines to help traders understand trend strength and direction.
A Bollinger Bands enhancement that identifies market volatility cycles, detecting price consolidation and potential breakouts with precise entry and exit signals.
Advanced volume-weighted RSI that adjusts traditional momentum indicator by incorporating trading volume, highlighting institutional moves and filtering out retail noise.
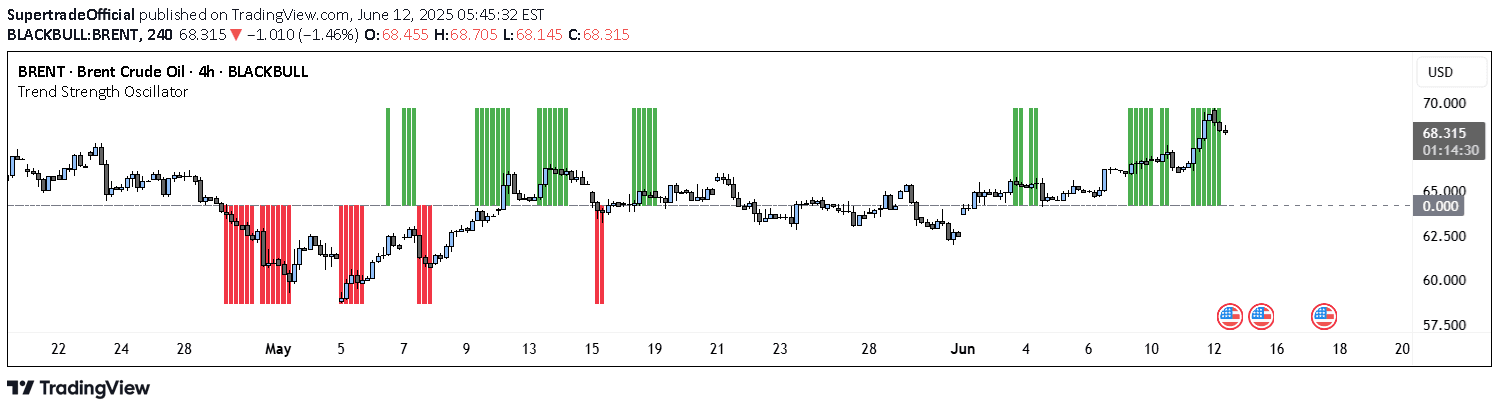
A comprehensive trend analysis tool that combines EMA, RSI, and ADX to provide a color-coded indicator of market trend strength and direction across different timeframes.
A custom trend detection indicator that combines momentum and volatility to identify market trends early, using Rate of Change and Standard Deviation calculations.
Likes, views, and comments are historical TradingView snapshots. They describe attention, not trading performance.