
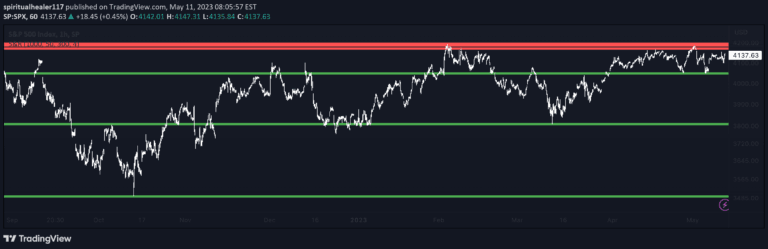
Autodrawn Support and Resistance Levels
An indicator that automatically identifies and draws key support and resistance levels across multiple timeframes using recent price highs and lows to help traders make informed trading decisions.
Explore 11,183 indicators. Filter beyond the obvious.
Discover the tools that fit the way you trade.
11,183 tools to explore
An indicator that automatically identifies and draws key support and resistance levels across multiple timeframes using recent price highs and lows to help traders make informed trading decisions.
An experimental probability indicator that predicts potential price movements by classifying returns into five categories based on historical price and technical indicator data.
A cointegration matrix analyzing 100 cryptocurrency pairs using ADF tests to determine potential correlations and relationships between different crypto assets.
A multi-length indicator measuring price exhaustion by comparing closing prices to moving averages across different timeframes, revealing overbought and oversold conditions.
A trading indicator that identifies potential price reversals by analyzing abnormal daily returns using a statistical probability distribution approach to detect oversold or overbought market conditions.
A position sizing calculator for Micro E-mini S&P 500 Futures that helps traders determine optimal contract quantities based on historical volatility and time-based regression models.
Likes, views, and comments are historical TradingView snapshots. They describe attention, not trading performance.