
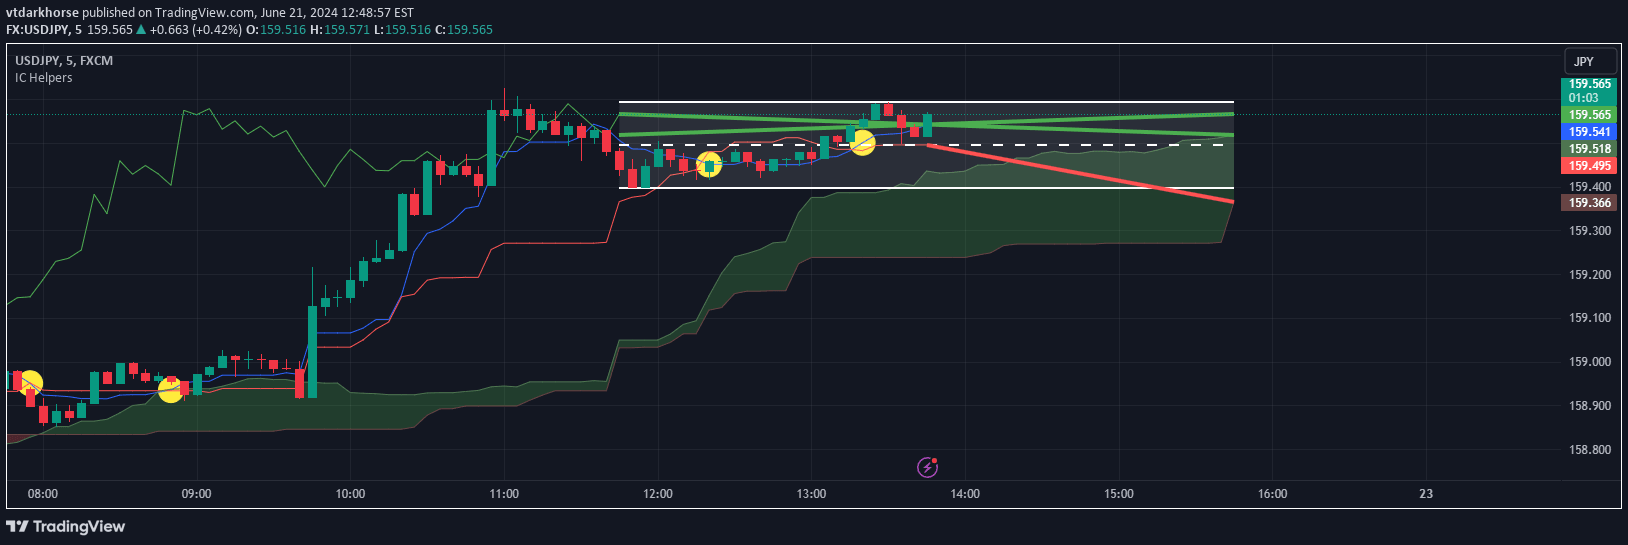
Ichimoku Cloud w/ Helpers
Ichimoku Cloud with advanced visualization and trend interpretation, featuring a dynamic analysis box and projection lines to help traders understand historical and future price movements.
Explore 11,183 indicators. Filter beyond the obvious.
Discover the tools that fit the way you trade.
11,183 tools to explore
Ichimoku Cloud with advanced visualization and trend interpretation, featuring a dynamic analysis box and projection lines to help traders understand historical and future price movements.
ATR X-Power is a graphical representation of Average True Range that displays daily price fluctuation ranges using horizontal lines and an X-shaped pattern around the starting price.
RSI Tree is a comparative analysis method that evaluates the relative strength of multiple financial instruments across different timeframes using Relative Strength Index.
Likes, views, and comments are historical TradingView snapshots. They describe attention, not trading performance.