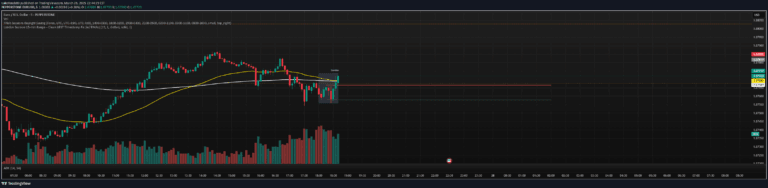
Watermark° (Quote, Name, Timeframe, Date)
A custom Tradingview indicator designed to display chart information cleanly while providing a personalized watermark for traders seeking discipline and self-mastery.
Explore 11,183 indicators. Filter beyond the obvious.
Discover the tools that fit the way you trade.
11,183 tools to explore
A custom Tradingview indicator designed to display chart information cleanly while providing a personalized watermark for traders seeking discipline and self-mastery.
The Advanced Exponential Smoothing Indicator provides a smoothed price representation that helps traders identify market trends and potential reversal points through exponential moving average analysis.
A linear regression-based trend indicator that uses volatility bands to visualize market trends and price dispersion, helping traders understand long-term market direction and stability.
Advanced RSI indicator using quantum-inspired mathematical principles to reveal market momentum and price movement fractal structures with customizable visual configurations.
A sophisticated 6-band parametric equalizer that allows precise frequency-based filtering of market data, enabling traders to shape and analyze price action with advanced signal processing techniques.
A trading signal tracking the London session's first 15-minute range with EMAs to help identify key price levels and trend direction during a specific market timeframe.
A TradingView indicator that marks the highest and lowest price levels between 5-6 PM AEST, visually extending these levels until midnight for tracking key price zones.
A trading strategy focusing on breakout and retest key levels to identify potential entry points and market movements across different trading scenarios.
Likes, views, and comments are historical TradingView snapshots. They describe attention, not trading performance.