Fear & Greed Index (Zeiierman)
The Fear & Greed Index measures market sentiment by analyzing seven key market indicators, providing traders with insights into potential market behavior and emotional extremes.
Explore 11,183 indicators. Filter beyond the obvious.
Discover the tools that fit the way you trade.
11,183 tools to explore
The Fear & Greed Index measures market sentiment by analyzing seven key market indicators, providing traders with insights into potential market behavior and emotional extremes.
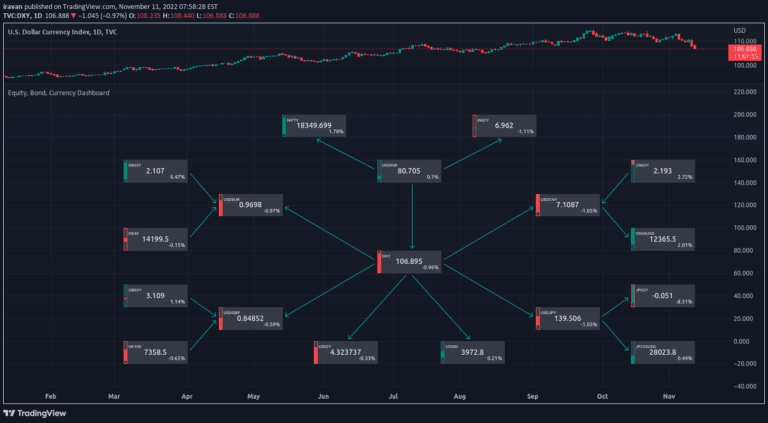
A comprehensive market flow visualization tool tracking demand dynamics across currencies, equities, and bonds of six countries, revealing interconnected market movements and smart money flows.
A widget tracking yield curve dynamics, allowing traders to compare current and historical yield curves and detect potential market inversions with a simple visual interface.
A comprehensive macro analysis tool tracking multiple assets and market regimes to provide insights into market performance, risk states, and potential economic trends.
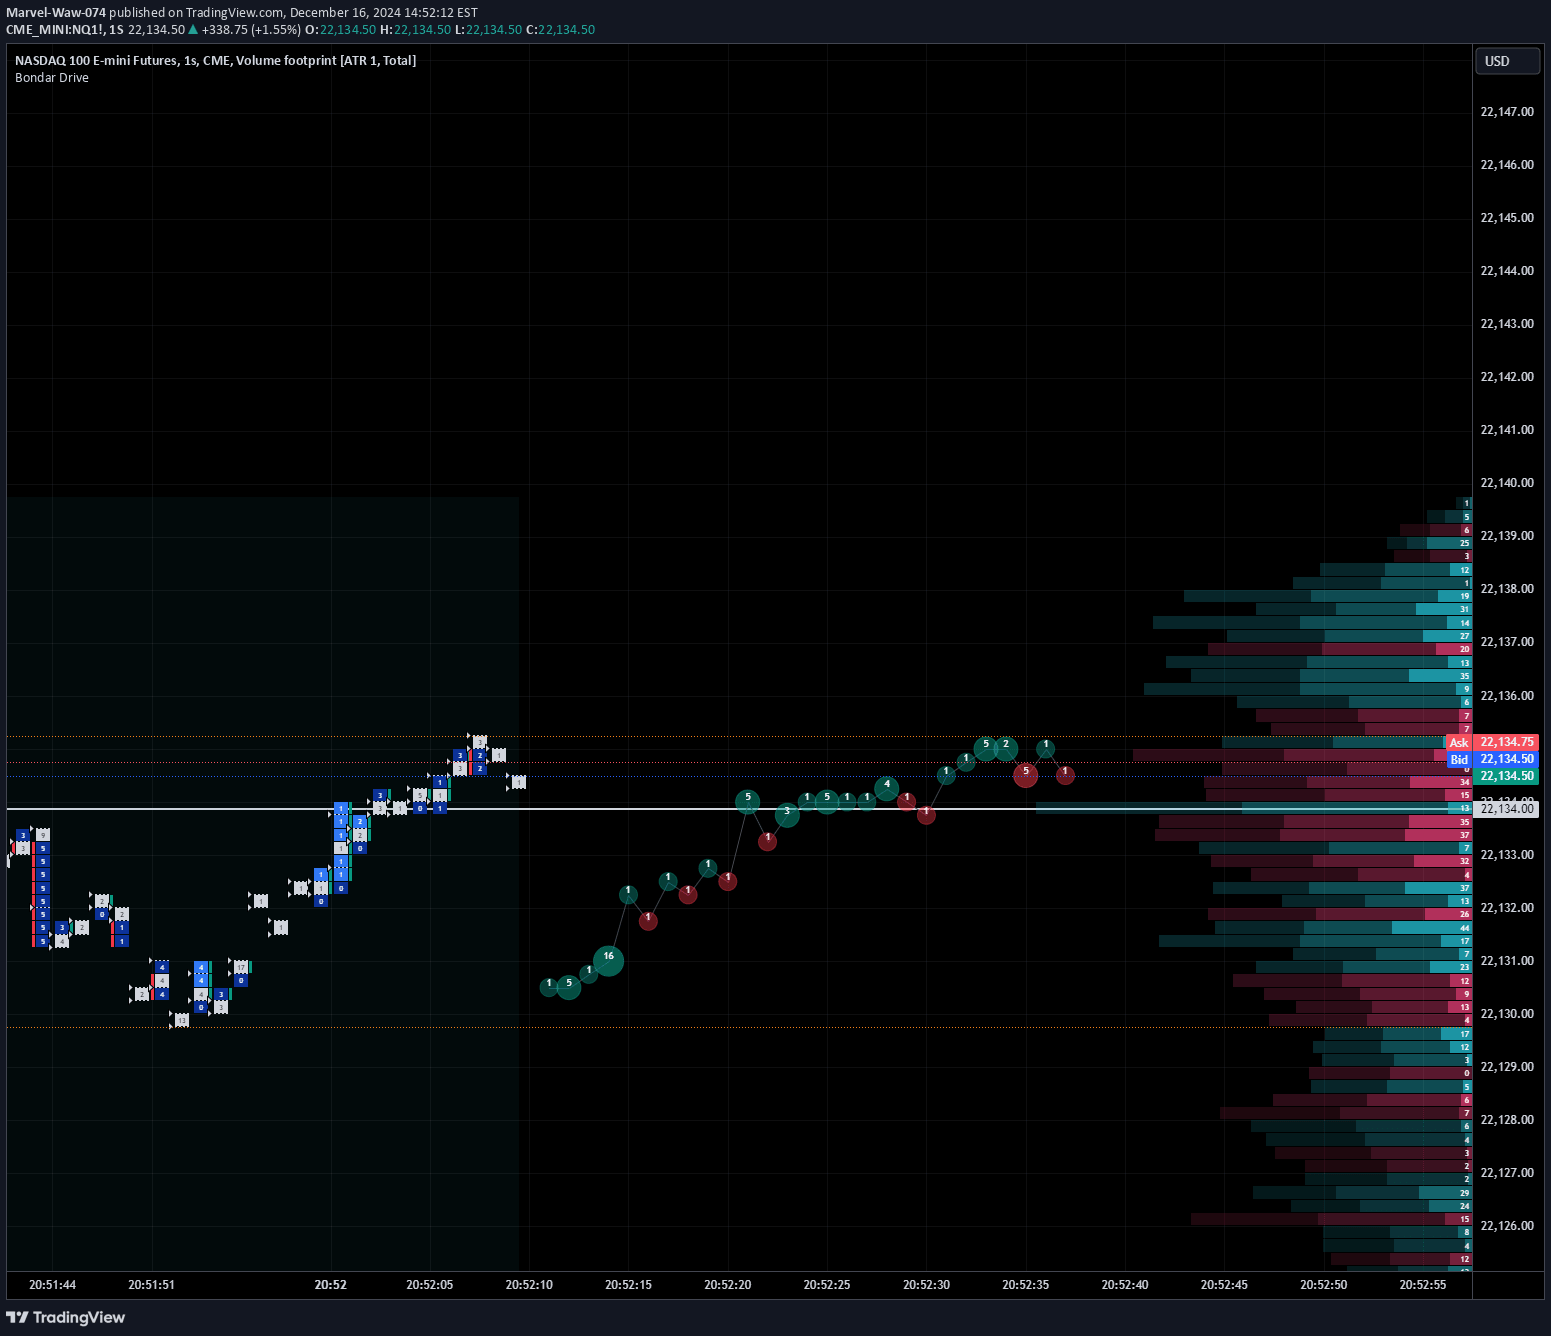
A real-time order flow visualization tool that tracks and displays volume deltas, print sizes, and order flow dynamics for comprehensive market analysis.
A proxy implementation of the Bloomberg Financial Conditions Index that assesses market stress by aggregating six key financial market components into a single standardized measure.
A yield curve indicator tracking the percentage of Treasury Bond yield spreads that are inverted, providing insights into potential economic downturns and market sentiment.
A comprehensive economic indicator aggregation tool that normalizes multiple financial metrics to provide a holistic view of market conditions and economic health.
Tracks trading volume of GME convertible notes to analyze bond-equity arbitrage and predict potential stock movements through bond trading signals.
A market sentiment indicator that quantifies investor emotions by analyzing seven key market factors to determine whether stock prices reflect fear or greed.
A composite z-score indicator using credit spreads and volatility indexes to assess market conditions and generate trading signals based on real-time market data.
Treasury Yields Heatmap is a dynamic tool tracking bond values and yield curve status across different countries using Pearson's linear regression coefficient.
Likes, views, and comments are historical TradingView snapshots. They describe attention, not trading performance.