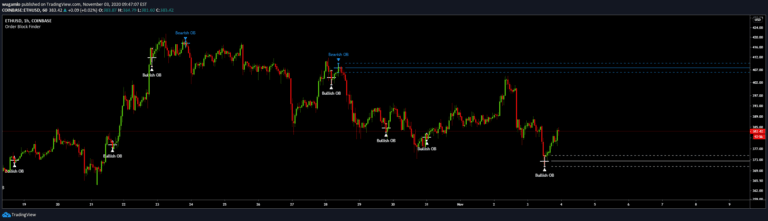
Market Structure Break & Order Block by EmreKb
A market structure break and order block indicator that identifies trend reversals by analyzing price action breakouts and key candle formations to signal potential trading opportunities.
Explore 11,183 indicators. Filter beyond the obvious.
Discover the tools that fit the way you trade.
11,183 tools to explore
A market structure break and order block indicator that identifies trend reversals by analyzing price action breakouts and key candle formations to signal potential trading opportunities.
An indicator identifying institutional order blocks by detecting significant price zones where potential trend reversals or continuations might occur based on sequential candle patterns.
A trading indicator that identifies breaker blocks and highlights potential entry points by detecting price action around support and resistance zones with premium/discount swing levels.
Auto-generated Fibonacci Retracements that identify market structure shifts and potential support/resistance zones based on technical breaks and price action dynamics.
A trading indicator that identifies unique price patterns using Fair Value Gaps and Breaker Blocks, highlighting potential entry and exit points with risk/reward targets.
A market structure indicator using fractal patterns to detect trend changes, support/resistance levels, and market reversals with adaptive analysis of price movements.
A candlestick pattern detection tool that identifies potential trend reversals using multiple pattern recognition techniques and stochastic oscillator filtering.
A trading indicator that identifies swing failure patterns by detecting price movements that exceed and then retreat from key swing levels, potentially signaling trend reversals.
A custom volume profile indicator that visualizes trading volume across custom time periods, splitting each period into halves and displaying volume and sentiment through color-coded histograms.
A tool that identifies potential price reversal zones using statistical probability by analyzing historical swing points and calculating precise percentile-based predictions.
An advanced trading indicator that detects price imbalances through a three-candle formation, highlighting potential support and resistance zones based on supply and demand disparities.
A trading indicator that detects market contraction phases, identifies major and minor patterns, and highlights potential expansion and markup zones through dynamic lines and levels.
Likes, views, and comments are historical TradingView snapshots. They describe attention, not trading performance.