Elastic Volume-Weighted Student-T Tension
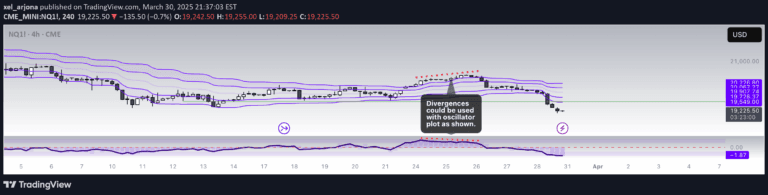
An advanced statistical indicator using volume-weighted Student-T distribution to dynamically track market volatility, providing adaptive tension bands and a normalized price oscillator.
Explore 11,183 indicators. Filter beyond the obvious.
Discover the tools that fit the way you trade.
11,183 tools to explore
An advanced statistical indicator using volume-weighted Student-T distribution to dynamically track market volatility, providing adaptive tension bands and a normalized price oscillator.
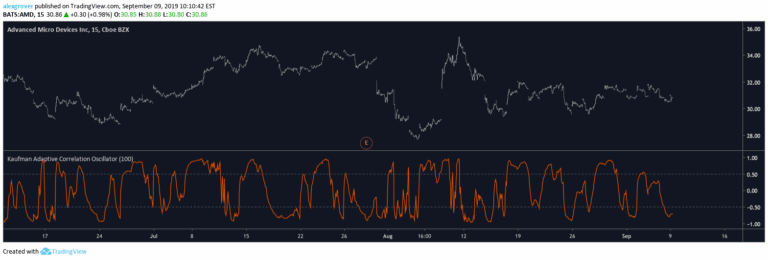
An adaptive correlation oscillator that measures linear relationships between market closing prices and a simple increasing line, using Kaufman adaptive moving average for smoother signal generation.
A statistical trading signal that analyzes historical returns, projects future confidence levels, and provides insights into potential price movements through probability and distribution analysis.
A statistical indicator that calculates cumulative distribution function, assessing probability distributions, kurtosis, and skewness for a given dataset to understand price movement characteristics.
A frequency histogram indicator that creates a bell curve distribution, analyzing market data's statistical properties and revealing price accumulation zones through comprehensive statistical analysis.
N-Degree Moment-Based Adaptive Detection (NDMBAD) is an advanced polynomial regression method for analyzing market trends and detecting deviations from data's core process.
Likes, views, and comments are historical TradingView snapshots. They describe attention, not trading performance.