Divergence for Many Indicators v4
Advanced trading tool that detects divergences across multiple technical indicators, helping traders identify potential trend reversals and momentum shifts through comprehensive pivot point analysis.
Explore 11,183 indicators. Filter beyond the obvious.
Discover the tools that fit the way you trade.
11,183 tools to explore
Advanced trading tool that detects divergences across multiple technical indicators, helping traders identify potential trend reversals and momentum shifts through comprehensive pivot point analysis.
A machine learning-powered SuperTrend indicator that uses k-means clustering to dynamically adapt to market volatility, providing intelligent trend identification and volatility insights.
Breakout Probability indicator calculates the likelihood of new market highs or lows by analyzing historical price action and displaying percentage probabilities for potential price levels.
A multi-indicator divergence script that analyzes divergences across 10 different technical indicators to identify potential trend reversals and price movements.
PMax Explorer is a trading strategy that combines moving stop loss and SuperTrend indicators to generate reliable buy and sell signals for trend identification and potential reversals.
A Linear Regression Channel indicator that tracks price trends, identifies channel breakouts, and analyzes momentum direction using dynamic visual signals and customizable settings.
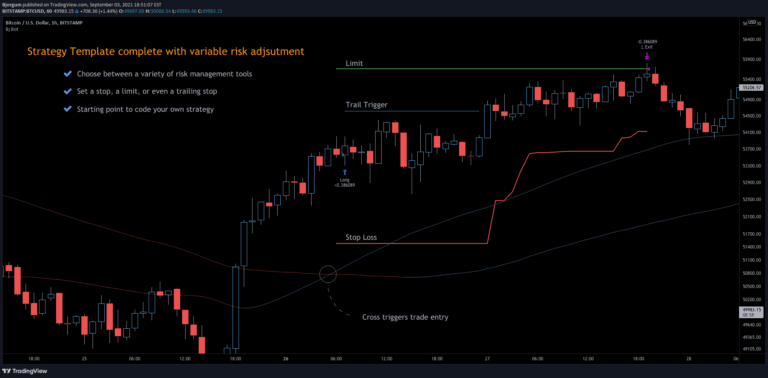
A 3Commas TradingView bot strategy offering automated trading with risk management, using moving average crossovers and customizable stop-loss and limit order settings.
A trading indicator tracking institutional investor actions by calculating probabilities of market structure changes and order flow direction for strategic trading decisions.
An advanced pattern recognition indicator that identifies ABC chart patterns using trend cloud, ZigZag, and Fibonacci levels to detect potential trading opportunities with customizable settings.
A trading indicator that uses pivot points to identify supply and demand zones, market structure, and potential trading opportunities through visual analysis of price action.
A technical analysis script that identifies cup-like price formations by creating channels and tracking potential breakout points in financial markets using specific bar search and channel width parameters.
A multi-timeframe support and resistance indicator that helps traders identify key price levels by analyzing market data across different time frames and customizable settings.
Likes, views, and comments are historical TradingView snapshots. They describe attention, not trading performance.