Live Economic Calendar by toodegrees
Live Economic Calendar tracks global financial news events, providing real-time updates on market-moving events across multiple currencies with impact levels and detailed visualizations.
Explore 11,183 indicators. Filter beyond the obvious.
Discover the tools that fit the way you trade.
11,183 tools to explore
Live Economic Calendar tracks global financial news events, providing real-time updates on market-moving events across multiple currencies with impact levels and detailed visualizations.
ICT Algorithmic Macro Tracker plots key trading time windows based on Inner Circle Trader methodology, helping traders identify potential market movement periods across specific time intervals.
A real-time volume delta and tick indicator providing detailed insights into market dynamics by analyzing live trading updates, focusing on price action and volume information at small timeframes.
A live footprint indicator showing bid/ask volume and delta at price levels, providing real-time trading volume insights with two distinct visualization modes.
An advanced trading indicator that tracks market structure, swing points, order blocks, and fair value gaps to identify potential trend reversals and continuation patterns in real-time.
A market structure indicator that detects changes in price delivery state by analyzing sequences of candles and identifying potential trend continuations or reversals.
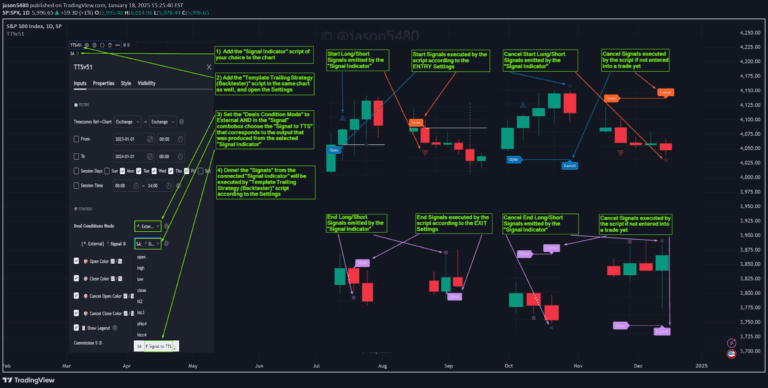
A flexible trading strategy framework enabling traders to develop, test, and evaluate custom trading logic with advanced signal management and comprehensive configuration options.
A multi-ticker dashboard that visually tracks swing structures across different timeframes, helping traders identify potential trend formations and market confluence.
A dynamic volume analysis tool that tracks volume flow, measures trading activity intensity, and provides real-time insights into buyer and seller dominance across different timeframes.
Pivot points are unique pattern recognition techniques for identifying market structure through sequential high and low formations across different bar configurations and complexity levels.
Trading Checklist is a customizable indicator that helps traders maintain discipline by creating and displaying personalized trading rules directly on a TradingView chart.
CISD is a technical analysis method for identifying market trend reversals by examining liquidity zones, key candles, and price action changes.
Likes, views, and comments are historical TradingView snapshots. They describe attention, not trading performance.