Bjorgum Key Levels
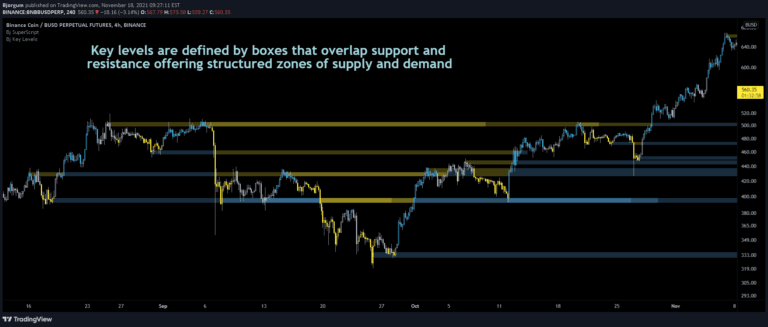
Key Levels strategy identifies critical price action points like breakouts, false breakouts, and backchecks to help traders understand market movement and potential trading opportunities.
Explore 11,183 indicators. Filter beyond the obvious.
Discover the tools that fit the way you trade.
11,183 tools to explore
Key Levels strategy identifies critical price action points like breakouts, false breakouts, and backchecks to help traders understand market movement and potential trading opportunities.
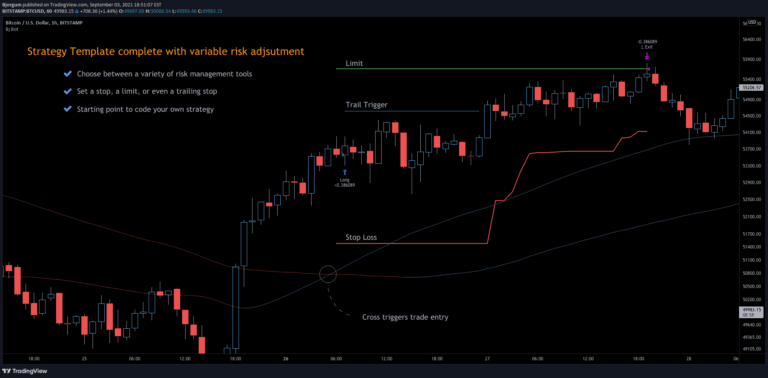
A 3Commas TradingView bot strategy offering automated trading with risk management, using moving average crossovers and customizable stop-loss and limit order settings.
Double Tap is a pattern recognition strategy that identifies double top and double bottom formations, providing entry signals based on price action reversals and breakout patterns.
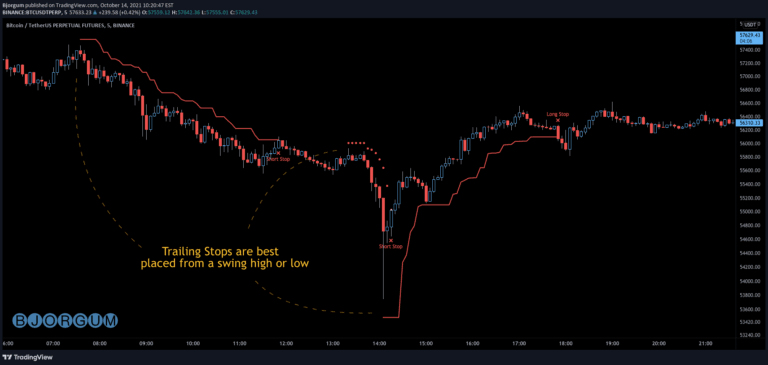
A versatile trailing stop management script for crypto and forex traders, offering multiple trail types to protect profits and manage risk dynamically during ongoing trades.
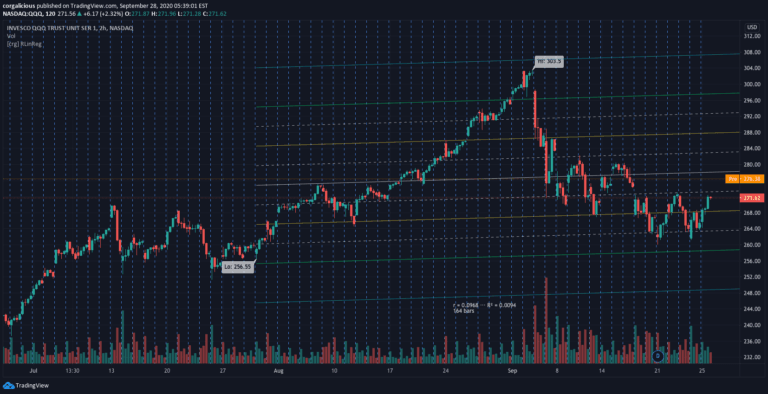
A versatile linear trend indicator that automatically adjusts to different chart resolutions, showing regression trends, RMSE channels, and period averages for quick trend analysis.
BjCandlePatterns is a comprehensive Japanese candlestick pattern recognition library that detects and labels various trading patterns to help traders identify potential market reversals and trend changes.
An advanced trading concept that identifies overnight price gaps in futures markets, using specific time frames and standard deviation projections to analyze potential market movements and liquidity zones.
A MACD-based indicator that identifies trend reversals through histogram divergences and an impulse system, helping traders spot potential market turning points across different timeframes.
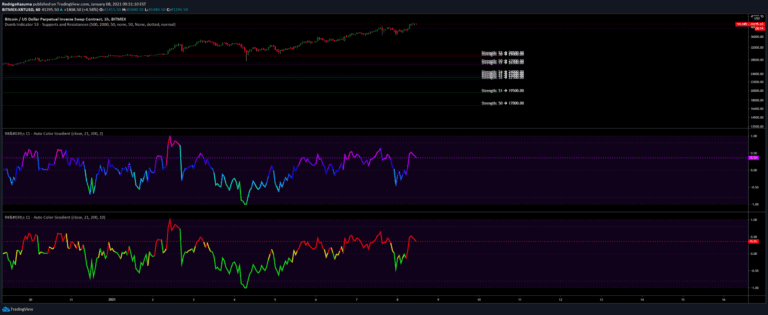
A color gradient framework for traders to simplify and enhance script visualization. It provides an automated method for color scaling based on data source and comparison scale.
The Reverse Relative Strength Index reveals potential price levels for specific RSI values, helping traders anticipate market movements and interpret price-momentum relationships.
The Stochastic Distance Indicator measures price distance from highs and lows, creating an oscillator that tracks trend strength and potential reversals using smoothed and unsmoothed values.
A MACD histogram divergence indicator that identifies potential trend reversals using advanced filtering and additional features like Impulse System and Keltner Channels.
Likes, views, and comments are historical TradingView snapshots. They describe attention, not trading performance.