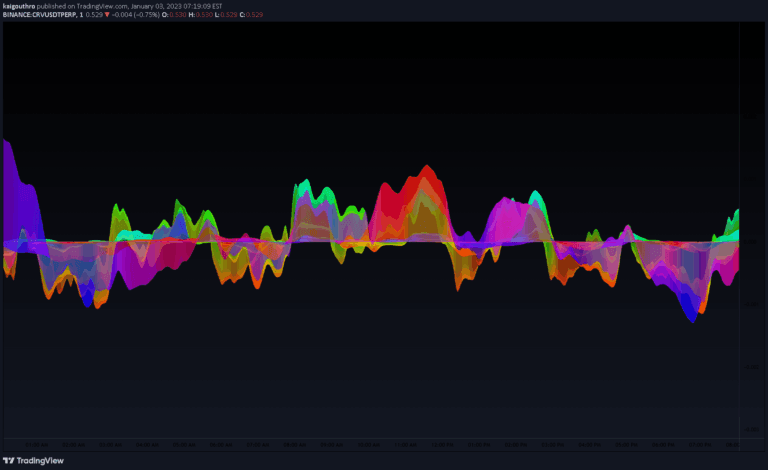
A color gradient framework for traders to simplify and enhance script visualization. It provides an automated method for color scaling based on data source and comparison scale.
Explore complementary indicator rolesHow it works
The framework allows traders to generate dynamic color gradients for data visualization. Users first copy the framework code into their script before plotting. Then they declare a color variable by calling the f_autocolor() function with two parameters: the source data to plot and the size of the comparison scale.
The function automatically generates a color gradient that helps visually represent data variations and trends. This approach simplifies color mapping by providing an automated method to transform numerical data into visual color representations. The framework adapts to different data sources and scales, making it versatile for various trading indicators
Why it may be useful
Color gradients can significantly improve data interpretation and visual analysis in trading scripts. By automatically mapping numerical data to colors, traders can quickly identify trends, patterns, and anomalies. The framework reduces manual color assignment work and provides a standardized approach to data visualization.
It helps traders rapidly assess market conditions through intuitive color representations. The automated scaling ensures consistent and meaningful color transitions across different data sets. This approach can enhance chart readability and help traders make faster, more informed decisions by presenting complex data in an easily digestible visual format
When to explore it
This color gradient framework is most effective when working with indicators that have numerical data with clear variations or trends. It works best in scripts where visual differentiation of data points is crucial for analysis. Traders can apply it to momentum indicators, trend-following strategies, and volume-based indicators.
The framework is particularly useful when comparing multiple data series or when tracking changes in indicator values over time. It is ideal for traders who want to add a layer of visual clarity to their technical analysis. The method is especially helpful in creating more intuitive and immediately comprehensible trading visualizations
Keep exploring
What we’ve verified
Access, alerts and repainting behaviour have not been independently verified for this indicator. Check the creator’s current publication and settings.
General descriptions and classifications are recovered research. Verified details above identify the specific checks we have completed. Check the creator’s current publication for later changes.