CM MACD Custom Indicator - Multiple Time Frame - V2
CM MACD Ultimate Multi-Timeframe V2 is an advanced MACD indicator with enhanced customization options, multi-timeframe analysis, and comprehensive trend visualization features.
Explore 11,183 indicators. Filter beyond the obvious.
Discover the tools that fit the way you trade.
11,183 tools to explore
CM MACD Ultimate Multi-Timeframe V2 is an advanced MACD indicator with enhanced customization options, multi-timeframe analysis, and comprehensive trend visualization features.
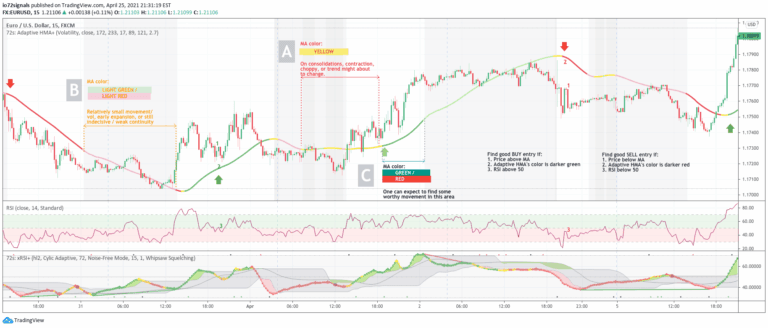
An adaptive Hull Moving Average that dynamically adjusts its period based on volume and volatility, providing clearer trend signals and market condition insights for traders.
A customizable market session tracker displaying trading hours for Tokyo, London, New York, and Sydney with multiple visualization options and advanced trading insights.
A volume heat map indicator that colors volume bars and candles based on the standard deviation of trading volume from its average. Provides visual insights into volume intensity and potential market significance.
Renko Candles Overlay is a charting technique that transforms price action into uniform-sized bricks, offering a simplified visual representation of market trends and price movements.
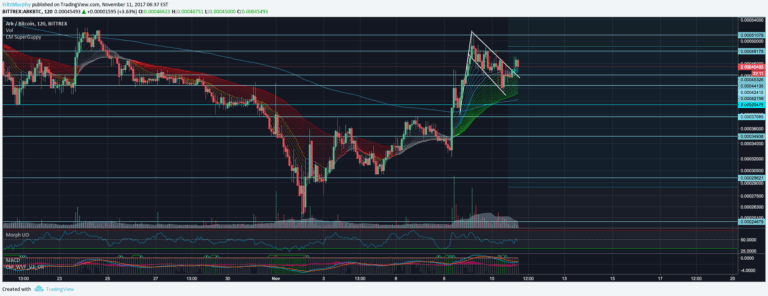
An enhanced Exponential Moving Average (EMA) script based on the Super Guppy format, designed to provide advanced trend analysis by utilizing multiple EMA lengths for comprehensive market insights.
A modified Supertrend indicator that adjusts ATR calculations based on candle colors to provide more precise stop loss and trend tracking in volatile markets.
An experimental trading signal applying the Logistic Map Equation to popular indicators like Awesome Oscillator, ROC, RSI, and Stochastic to generate unique market insights through iterative mathematical calculations.
A multi-timeframe candle visualization script that provides advanced trading insights, including volume information, remaining candle time, and breakout detection with customizable display options.
A dynamic trend channel indicator that identifies market trends, projects future prices, and provides visual signals for potential trade opportunities using SMA and volatility calculations.
Kalman Trend Levels is an advanced indicator that identifies trend shifts, support/resistance zones, and momentum changes using dynamic Kalman filter crossovers and adaptive visualization techniques.
A volume footprint indicator that divides candles into intervals, showing the distribution of trading volume across different price levels within a single candlestick.
Likes, views, and comments are historical TradingView snapshots. They describe attention, not trading performance.