Machine Learning: Logistic Regression
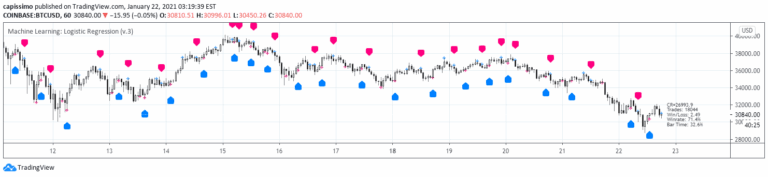
A machine learning strategy using logistic regression to classify market movements into binary categories by fitting a sigmoid curve to predict potential trading directions.
Explore 11,183 indicators. Filter beyond the obvious.
Discover the tools that fit the way you trade.
11,183 tools to explore
A machine learning strategy using logistic regression to classify market movements into binary categories by fitting a sigmoid curve to predict potential trading directions.
A custom moving average using a beta distribution weighting function that allows traders to control lag and smoothness, offering flexible trend analysis with adjustable parameters.
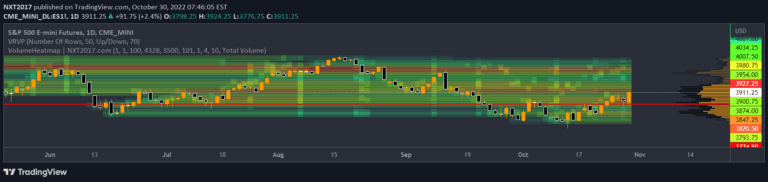
A volume heatmap indicator that identifies price levels with the most trading volume, helping traders find key market activity zones and potential value trading targets.
A volume footprint indicator that divides candles into intervals, showing the distribution of trading volume across different price levels within a single candlestick.
An advanced trend detection tool that uses EMA crossovers to identify market flow, dynamic price levels, and trend momentum with visual gradient bands.
A momentum indicator that uses Hull Moving Average to track price shifts, creating dynamic five-level zones that highlight momentum strength and potential trend changes.
A custom Donchian channel-based zig-zag indicator that tracks price extremities, offering unique insights into market movements and potential support/resistance levels.
RSI Primed combines candlestick visualization techniques with RSI to provide advanced market trend analysis and momentum insights across multiple charting modes.
An advanced RSI-based indicator that identifies periods of suppressed volatility, visualizes suppression zones, and highlights potential breakout dynamics in price movements.
A dynamic trend-following indicator that blends trend detection with volume visualization, offering insights into market momentum through color-coded candles and volume histograms.
A two-pole filter trend indicator that smooths price data, uses gradient colors to show trend strength, and plots dynamic support/resistance dots to help traders identify market trends and potential reversals.
A sophisticated trading indicator using Bayesian probability theory and multiple moving averages to assess market trends and predict potential price direction with statistical precision.
Likes, views, and comments are historical TradingView snapshots. They describe attention, not trading performance.