YOUR INDICATOR RESEARCH STARTS HERE

Find the right indicator.
Understand what it does.

Explore 11,183 indicators. Filter beyond the obvious.
Discover the tools that fit the way you trade.

THE INDICATOR LIBRARY

Results for “SIZE”

11,183 tools to explore

511 indicators matching your filters
Save search
VolumeEditor’s pick

Volume Profile / Fixed Range

by LonesomeTheBlue

A Volume Profile indicator that calculates trading volumes within a fixed range, helping traders understand volume distribution and identifying key price levels with visual representation.

Main price chart · unverifiedDay Trading · Swing Trading
Explore
13.4Klikes576.6Kviews171comments

Save
TrendVolatilityEditor’s pick

Renko Candles Overlay

by LonesomeTheBlue

Renko Candles Overlay is a charting technique that transforms price action into uniform-sized bricks, offering a simplified visual representation of market trends and price movements.

Main price chart · unverifiedDay Trading · Swing Trading
Explore
6.6Klikes169.7Kviews135comments
Save
ChannelsSignalTrend

Channels With Patterns [ChartPrime]

by ChartPrime

An advanced trend channel indicator using pivot points and ATR to estimate trend direction quickly, with integrated candlestick pattern recognition for enhanced trading insights.

Main price chart · unverifiedScalping · Day Trading
Explore
4.3Klikes101.9Kviews16comments
Save
LevelsSignalVolume

High Volume Points [BigBeluga]

by BigBeluga

A volume-based indicator that highlights key liquidity zones by detecting high-volume pivots and visualizing market activity through dynamic markers and support/resistance levels.

Main price chart · unverifiedScalping · Day Trading
Explore
4Klikes80.1Kviews77comments
Save
TrendVolatilityEditor’s pick

Higher Time Frame Chart Overlay

by LonesomeTheBlue

A customizable Pine Script indicator that generates a mini-chart displaying the last 10 candles with detailed visual settings, providing quick insights into recent price action and market behavior.

Main price chart · unverifiedDay Trading · Swing Trading
Explore
3.9Klikes123.7Kviews121comments
Save
LevelsSignal

Liquidity Grabs | Flux Charts

by fluxchart

A liquidity grab indicator that highlights market order execution points by rendering unique bubbles on candles where significant liquidity areas are swept with large wicks.

Main price chart · unverifiedScalping · Day Trading
Explore
3.5Klikes75.5Kviews9comments
Save
LevelsSignalTrend

HTF Fair Value Gap [LuxAlgo]

by LuxAlgo

A higher timeframe indicator that identifies and visualizes fair value gaps in price movement, highlighting potential trading opportunities through color-coded background and candle representations.

Main price chart · unverifiedScalping · Day Trading
Explore
3.1Klikes75.7Kviews30comments
Save
VolumeTrendEditor’s pick

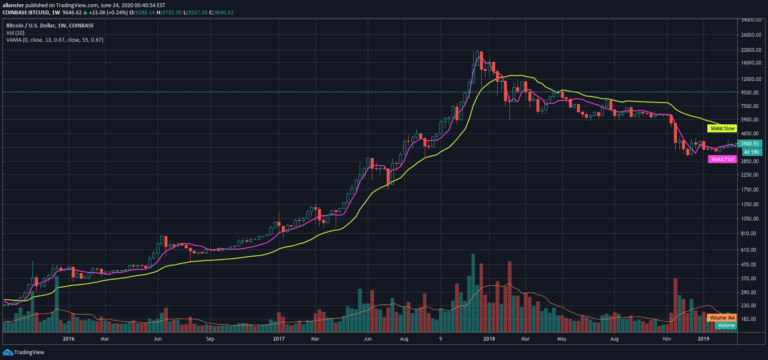
VAMA Volume Adjusted Moving Average Function

by allanster

Volume Adjusted Moving Average (VAMA) is an advanced indicator that calculates moving averages based on volume increments rather than traditional time-based methods, offering a unique perspective on price trends.

Main price chart · unverifiedDay Trading · Swing Trading
Explore
2.8Klikes64.8Kviews36comments
Save
ChannelsSignalTrend

AI Channels (Clustering) [LuxAlgo]

by LuxAlgo

AI Channels indicator uses K-means clustering to identify trend directions and potential price breakouts by analyzing price clusters and their centroids dynamically.

Main price chart · unverifiedScalping · Day Trading
Explore
2.7Klikes109.6Kviews16comments
Save

Likes, views, and comments are historical TradingView snapshots. They describe attention, not trading performance.

START WITH A QUESTION

A little less searching.
A lot more understanding.

Tell DeepAlpha what you need. Get an explanation, a shortlist,
and a direct path to the indicators behind it.

Ask DeepAlpha