Divergence for Many Indicators v4
Advanced trading tool that detects divergences across multiple technical indicators, helping traders identify potential trend reversals and momentum shifts through comprehensive pivot point analysis.
Explore 11,183 indicators. Filter beyond the obvious.
Discover the tools that fit the way you trade.
11,183 tools to explore
Advanced trading tool that detects divergences across multiple technical indicators, helping traders identify potential trend reversals and momentum shifts through comprehensive pivot point analysis.
A Linear Regression Channel indicator that tracks price trends, identifies channel breakouts, and analyzes momentum direction using dynamic visual signals and customizable settings.
An advanced trading indicator that identifies trendline breakouts and breakdowns, providing precise entry signals, target calculations, and visual trade management tools.
A trading indicator that identifies swing failure patterns by detecting price movements that exceed and then retreat from key swing levels, potentially signaling trend reversals.
A comprehensive price action toolkit that analyzes market structure, liquidity, order blocks, and trend lines to help traders identify potential entry and exit points.
A dynamic trendline indicator that detects and highlights support/resistance lines in real-time, with customizable filters for angle, length, and break detection across different market conditions.
A comprehensive multi-indicator script that displays various technical indicators in separate windows, allowing traders to customize and analyze market momentum, volume, and trend signals.
A dynamic trendline indicator that tracks market trends across three different timeframes, using swing points and color-coded visualizations to highlight potential trend shifts and price movements.
A Pine Script trendline library that identifies pivot points and potential market trend shifts using a dynamic breakout system with customizable settings.
A trading system for identifying potential trend reversals using setup and count methods with support and resistance levels for strategic market entry and exit points.
A multi-timeframe market structure indicator that identifies trend shifts, breaks of structure, and market structure patterns across different time frames with high customization.
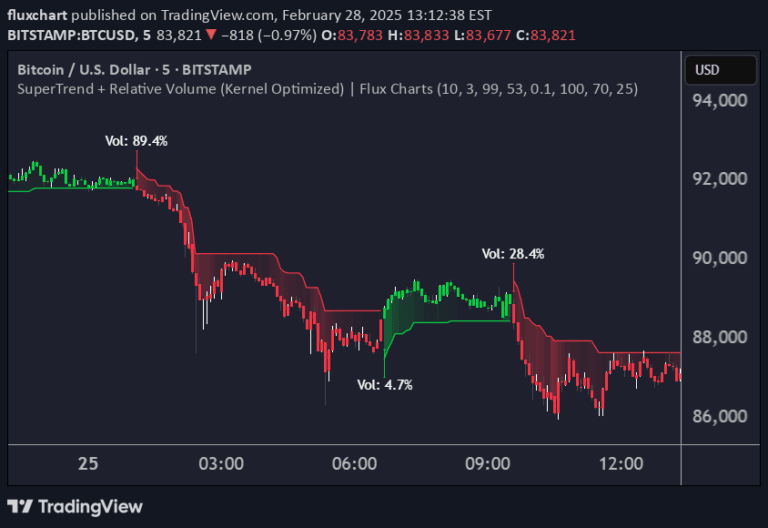
An advanced trading indicator combining Supertrend and Relative Volume using Kernel Density Estimation to predict trend breaks with probabilistic precision and volume confirmation.
Likes, views, and comments are historical TradingView snapshots. They describe attention, not trading performance.