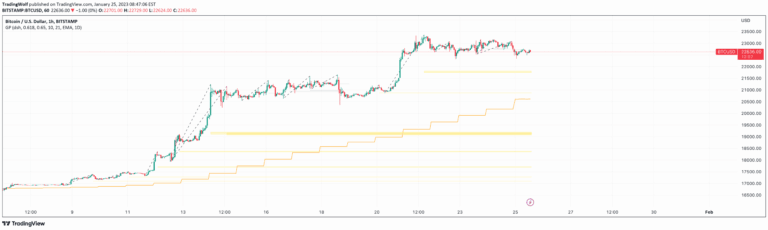
Trend Reversal System with SR levels
A trading system for identifying potential trend reversals using setup and count methods with support and resistance levels for strategic market entry and exit points.
Explore 11,183 indicators. Filter beyond the obvious.
Discover the tools that fit the way you trade.
11,183 tools to explore
A trading system for identifying potential trend reversals using setup and count methods with support and resistance levels for strategic market entry and exit points.
The Adaptive Moving Average (AMA) Signals indicator dynamically adjusts to market volatility, providing responsive trend identification and trading signals by measuring market efficiency and price directionality.
Golden Pocket is a Fibonacci retracement tool that identifies key price levels between 0.618 and 0.65, helping traders find potential entry points during market retracements.
Chart pattern analysis focusing on flag and pennant formations that identify potential trend continuation after strong impulse waves, helping traders anticipate market momentum.
TTP VIX Spy is a trading indicator that uses VIX momentum to identify potential market entry points by analyzing fear and risk in the market through MACD and RSI filters.
The Trend Counter analyzes market direction by counting price bars above and below average levels, providing visual insights into trend strength and potential reversals.
A dynamic trading indicator that identifies trend breakouts and reversals using pivot points, drawing support and resistance channels with color-coded signals for potential market direction changes.
A hybrid indicator combining 12 different oscillators to detect overbought and oversold conditions by normalizing and analyzing multiple technical indicators simultaneously.
A multi-indicator trading tool that combines RSI, CCI, and Stochastic Oscillator to capture market momentum and trend changes with customizable parameters and dynamic levels.
A utility indicator that counts candles in a specific time period, helping traders analyze candle composition and precisely adjust timeframe-based indicators.
RSI OB/OS Strategy Analyzer helps traders identify overbought/oversold market conditions by calculating Relative Strength Index and generating performance metrics for potential mean-reversion trades.
A MACD-based indicator that identifies trend reversals through histogram divergences and an impulse system, helping traders spot potential market turning points across different timeframes.
Likes, views, and comments are historical TradingView snapshots. They describe attention, not trading performance.