YOUR INDICATOR RESEARCH STARTS HERE

Find the right indicator.
Understand what it does.

Explore 11,183 indicators. Filter beyond the obvious.
Discover the tools that fit the way you trade.

THE INDICATOR LIBRARY

Results for “dates”

11,183 tools to explore

91 indicators matching your filters
Save search
MomentumVolatilityEditor’s pick

Black-Scholes Options Pricing Model

by SegaRKO

A comprehensive options pricing and risk analysis tool using the Black-Scholes model, providing theoretical option prices, Greeks, and implied volatility for accurate options trading insights.

Separate pane · unverifiedDay Trading · Swing Trading
Explore
1.3Klikes40.3Kviews22comments
Save
MomentumSignal

Optimal Buy Day (Zeiierman)

by Zeiierman

The Optimal Buy Day indicator analyzes historical price data to identify the most advantageous days for monthly investments, comparing systematic and randomized buying strategies.

Separate pane · unverifiedSwing Trading
Explore
469likes13.5Kviews3comments
Save
LevelsTrend

Multi VWAP [MW]

by mwrightinc

Multi VWAP tool creates automatic Anchored Volume Weighted Average Price lines for various timeframes, helping traders identify trend direction and institutional trading levels.

Main price chart · unverifiedDay Trading · Swing Trading
Explore
421likes9.3Kviews27comments
Save
OscillatorSignal

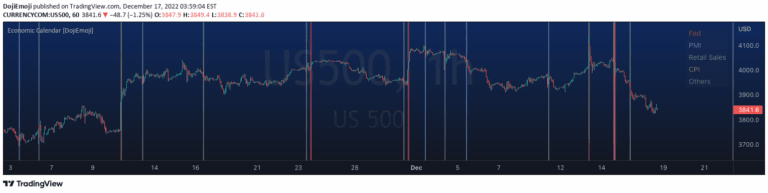
Astro: Planetary Aspect Dates

by BarefootJoey

A chart overlay that highlights planetary aspects in financial markets, tracking the angular relationships between celestial bodies and their potential trading influences.

Separate pane · unverifiedDay Trading · Swing Trading
Explore
361likes9.8Kviews24comments
Save
TrendVolatilityEditor’s pick

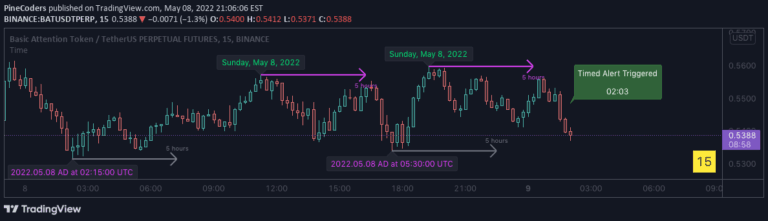
Time

by PineCoders

A Pine Script library offering advanced time manipulation functions to format timestamps, calculate time offsets, and convert time units for precise trading analysis and visualization.

Main price chart · unverifiedDay Trading · Swing Trading
Explore
302likes29.7Kviews35comments
Save
SignalTrend

Bitcoin Halving Dates + Countdown

by KevinSvenson_

A Bitcoin halving indicator that tracks and visualizes historical and upcoming Bitcoin halving events, providing traders with key dates and a real-time countdown to the next significant crypto milestone.

Main price chart · unverifiedSwing Trading
Explore
208likes7.8Kviews1comments
Save

Likes, views, and comments are historical TradingView snapshots. They describe attention, not trading performance.

START WITH A QUESTION

A little less searching.
A lot more understanding.

Tell DeepAlpha what you need. Get an explanation, a shortlist,
and a direct path to the indicators behind it.

Ask DeepAlpha